New Insights on the Physical Nature of the Atmospheric Greenhouse Effect Deduced from an Empirical Planetary Temperature Model
Ned Nikolov* and Karl Zeller
Ksubz LLC, 9401 Shoofly Lane, Wellington CO 80549, USA
- Corresponding Author:
- Ned Nikolov
Ksubz LLC, 9401 Shoofly Lane
Wellington CO 80549, USA
Tel: 970-980-3303, 970-206-0700
E-mail: ntconsulting@comcast.net
Received date: November 11, 2016; Accepted date: February 06, 2017; Published date: February 13, 2017
Citation: Nikolov N, Zeller K (2017) New Insights on the Physical Nature of the Atmospheric Greenhouse Effect Deduced from an Empirical Planetary Temperature Model. Environ Pollut Climate Change 1:112.s
Copyright: © 2017 Nikolov N, et al. This is an open-access article distributed under the terms of the Creative Commons Attribution License, which permits unrestricted use, distribution, and reproduction in any medium, provided the original author and source are credited.
Abstract
A recent study has revealed that the Earth’s natural atmospheric greenhouse effect is around 90 K or about 2.7 times stronger than assumed for the past 40 years. A thermal enhancement of such a magnitude cannot be explained with the observed amount of outgoing infrared long-wave radiation absorbed by the atmosphere (i.e. ≈ 158 W m-2), thus requiring a re-examination of the underlying Greenhouse theory. We present here a new investigation into the physical nature of the atmospheric thermal effect using a novel empirical approach toward predicting the Global Mean Annual near-surface equilibrium Temperature (GMAT) of rocky planets with diverse atmospheres. Our method utilizes Dimensional Analysis (DA) applied to a vetted set of observed data from six celestial bodies representing a broad range of physical environments in our Solar System, i.e. Venus, Earth, the Moon, Mars, Titan (a moon of Saturn), and Triton (a moon of Neptune). Twelve relationships (models) suggested by DA are explored via non-linear regression analyses that involve dimensionless products comprised of solar irradiance, greenhouse-gas partial pressure/density and total atmospheric pressure/density as forcing variables, and two temperature ratios as dependent variables. One non-linear regression model is found to statistically outperform the rest by a wide margin. Our analysis revealed that GMATs of rocky planets with tangible atmospheres and a negligible geothermal surface heating can accurately be predicted over a broad range of conditions using only two forcing variables: top-of-the-atmosphere solar irradiance and total surface atmospheric pressure. The hereto discovered interplanetary pressure-temperature relationship is shown to be statistically robust while describing a smooth physical continuum without climatic tipping points. This continuum fully explains the recently discovered 90 K thermal effect of Earth’s atmosphere. The new model displays characteristics of an emergent macro-level thermodynamic relationship heretofore unbeknown to science that has important theoretical implications. A key entailment from the model is that the atmospheric ‘greenhouse effect’ currently viewed as a radiative phenomenon is in fact an adiabatic (pressure-induced) thermal enhancement analogous to compression heating and independent of atmospheric composition. Consequently, the global down-welling long-wave flux presently assumed to drive Earth’s surface warming appears to be a product of the air temperature set by solar heating and atmospheric pressure. In other words, the so-called ‘greenhouse back radiation’ is globally a result of the atmospheric thermal effect rather than a cause for it. Our empirical model has also fundamental implications for the role of oceans, water vapour, and planetary albedo in global climate. Since produced by a rigorous attempt to describe planetary temperatures in the context of a cosmic continuum using an objective analysis of vetted observations from across the Solar System, these findings call for a paradigm shift in our understanding of the atmospheric ‘greenhouse effect’ as a fundamental property of climate.
Keywords
Greenhouse effect; Emergent model; Planetary temperature; Atmospheric pressure; Greenhouse gas; Mars temperature
Introduction
In a recent study Volokin et al. [
1] demonstrated that the strength of Earth’s atmospheric
Greenhouse Effect (GE) is about 90 K instead of 33 K as presently assumed by most researchers e.g. [
2-
7]. The new estimate corrected a long-standing mathematical error in the application of the Stefan–Boltzmann (SB) radiation law to a sphere pertaining to Hölder’s inequality between integrals. Since the current greenhouse theory strives to explain GE solely through a retention (trapping) of outgoing long-wavelength (LW) radiation by atmospheric gases [
2,
5,
7-
10], a thermal enhancement of 90 K creates a logical conundrum, since satellite observations constrain the global atmospheric LW absorption to 155–158 W m
-2 [
11-
13]. Such a flux might only explain a surface warming up to 35 K. Hence, more than 60% of Earth’s 90 K
atmospheric effect appears to remain inexplicable in the context of the current theory. Furthermore, satellite- and surface-based radiation measurements have shown [
12-
14] that the lower troposphere emits 42-44% more radiation towards the surface (i.e., 341-346 W m
-2) than the net shortwave flux delivered to the Earth-atmosphere system by the Sun (i.e., 240 W m
-2). In other words, the lower troposphere contains significantly more kinetic energy than expected from solar heating alone, a conclusion also supported by the new 90 K GE estimate. A similar but more extreme situation is observed on Venus as well, where the atmospheric downwelling LW radiation near the surface (>15,000 W m
-2) exceeds the total absorbed solar flux (65–150 W m
-2) by a factor of 100 or more [
6]. The radiative greenhouse theory cannot explain this apparent paradox considering the fact that infrared-absorbing gases such as CO
2, water vapor and methane only re-radiate available LW emissions and do not constitute significant heat storage or a net source of additional energy to the system. This raises a fundamental question about the origin of the observed energy surplus in the lower troposphere of terrestrial planets with respect to the solar input. The above inconsistencies between theory and observations prompted us to take a new look at the mechanisms controlling the atmospheric thermal effect.
We began our study with the premise that processes controlling the Global Mean Annual near-surface Temperature (GMAT) of
Earth are also responsible for creating the observed pattern of planetary temperatures across the Solar System. Thus, our working hypothesis was that a general physical model should exist, which accurately describes GMATs of planets using a common set of drivers. If so, then such a model would also reveal the forcing behind the atmospheric thermal effect.
Instead of examining existing mechanistic models such as 3-D GCMs, we decided to try an empirical approach not constrained by a particular physical theory. An important reason for this was the fact that current process-oriented climate models rely on numerous theoretical assumptions while utilizing planet-specific parameterizations of key processes such as vertical convection and cloud nucleation in order to simulate the surface thermal regime over a range of planetary environments [
15]. These empirical parameterizations oftentimes depend on detailed observations that are not typically available for planetary bodies other than Earth. Hence, our goal was to develop a simple yet robust planetary temperature model of high predictive power that does not require case-specific parameter adjustments while successfully describing the observed range of planetary temperatures across the Solar System.
Methods and Data
In our model development we employed a ‘top-down’ empirical approach based on Dimensional Analysis (DA) of observed data from our Solar System. We chose DA as an analytic tool because of its ubiquitous past successes in solving complex problems of physics, engineering, mathematical biology, and biophysics [
16-
21]. To our knowledge DA has not previously been applied to constructing predictive models of macro-level properties such as the average global temperature of a planet; thus, the following overview of this technique is warranted.
Dimensional analysis background
DA is a method for extracting physically meaningful relationships from empirical data [
22-
24]. The goal of DA is to restructure a set of original variables deemed critical to describing a physical phenomenon into a smaller set of independent dimensionless products that may be combined into a dimensionally homogeneous model with predictive power. Dimensional homogeneity is a prerequisite for any robust physical relationship such as natural laws. DA distinguishes between measurement units and physical dimensions. For example, mass is a physical dimension that can be measured in gram, pound, metric ton etc.; time is another dimension measurable in seconds (s), hour (h), years, etc. While the physical dimension of a variable does not change, the units quantifying that variable may vary depending on the adopted measurement system.
Many physical variables and constants can be described in terms of four fundamental dimensions, i.e., mass [M], length [L], time [T], and absolute temperature [Θ]. For example, an energy flux commonly measured in W m
-2 has a physical dimension [M T
-3] since 1 W m
-2=1 J s
-1 m
-2=1 (kg m2 s
-2) s
-1 m
-2=kg s-3. Pressure may be reported in units of Pascal, bar, atm., PSI or Torr, but its physical dimension is always [M L
-1 T
-2] because 1 Pa=1 N m
-2=1 (kg m s
-2) m
-2=1 kg m
-1 s
-2. Thinking in terms of physical dimensions rather than measurement units fosters a deeper understanding of the underlying physical reality. For instance, a comparison between the physical dimensions of
energy flux and pressure reveals that a flux is simply the product of pressure and the speed of moving particles [L T
-1], i.e., [M T
-3]=[M L
-1 T
-2] [L T
-1]. Thus, a radiative flux FR (W m
-2) can be expressed in terms of photon pressure Pph (Pa) and the speed of light c (m s
-1) as Fr=cPph. Since c is constant within a medium, varying the intensity of electromagnetic radiation in a given medium effectively means altering the pressure of photons. Thus, the solar radiation reaching Earth’s upper atmosphere exerts a pressure (force) of sufficient magnitude to perturb the orbits of communication satellites over time [
25,
26].
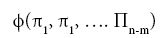
The simplifying power of DA in model development stems from the Buckingham Pi Theorem [
27], which states that a problem involving n dimensioned xi variables, i.e.,
can be reformulated into a simpler relationship of (n-m) dimensionless πi products derived from xi, i.e.,
where m is the number of fundamental dimensions comprising the original variables. This theorem determines the number of nondimensional π
i variables to be found in a set of products, but it does not prescribe the number of sets that could be generated from the original variables defining a particular problem. In other words, there might be, and oftentimes is more than one set of (n-m) dimensionless products to analyze. DA provides an objective method for constructing the sets of π
i variables employing simultaneous equations solved via either matrix inversion or substitution [
22].
The second step of DA (after the construction of dimensionless products) is to search for a functional relationship between the πivariables of each set using regression analysis. DA does not disclose the best function capable of describing the empirical data. It is the investigator’s responsibility to identify a suitable regression model based on prior knowledge of the phenomenon and a general expertise in the subject area. DA only guarantees that the final model (whatever its functional form) will be dimensionally homogeneous, hence it may qualify as a physically meaningful relationship provided that it (a) is not based on a simple polynomial fit; (b) has a small standard error; (c) displays high predictive skill over a broad range of input data; and (d) is statistically robust. The regression coefficients of the final model will also be dimensionless, and may reveal true constants of Nature by virtue of being independent of the units utilized to measure the forcing variables.
Selection of model variables
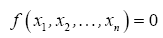
A planet’s GMAT depends on many factors. In this study, we focused on drivers that are remotely measurable and/or theoretically estimable. Based on the current state of knowledge we identified seven physical variables of potential relevance to the global surface temperature: 1) topof- the-atmosphere (TOA) solar irradiance (S); 2) mean planetary surface temperature in the absence of atmospheric greenhouse effect, hereto called a reference temperature (Tr); 3) near-surface partial pressure of atmospheric greenhouse gases (Pgh); 4) near-surface mass density of atmospheric greenhouse gases (ρgh); 5) total surface atmospheric pressure (P); 6) total surface atmospheric density (ρ); and 7) minimum air pressure required for the existence of a liquid solvent at the surface, hereto called a reference pressure (Pr). Table 1 lists the above variables along with their SI units and physical dimensions. Note that, in order to simplify the derivation of dimensionless products, pressure and density are represented in Table 1 by the generic variables Px and ρx, respectively. As explained below, the regression analysis following the construction of πi variables explicitly distinguished between models involving partial pressure/density of greenhouse gases and those employing total atmospheric pressure/density at the surface. The planetary Bond albedo (αp) was omitted as a forcing variable in our DA despite its known effect on the surface energy budget, because it is already dimensionless and also partakes in the calculation of reference temperatures discussed below.
| Planetary Variable | Symbol | SI Units | Physical Dimension |
|---|
| Global mean annual near-surface temperature (GMAT), the dependent variable | Ts | K | [Θ] |
| Stellar irradiance (average shortwave flux incident on a plane perpendicular to the stellar rays at the top of a planet’s atmosphere) | S | W m-2 | [M T-3] |
| Reference temperature (the planet’s mean surface temperature in the absence of an atmosphere or an atmospheric greenhouse effect) | Tr | K | [Θ] |
| Average near-surface gas pressure representing either partial pressure of greenhouse gases or total atmospheric pressure | Px | Pa | [M L-1 T-2] |
| Average near-surface gas density representing either greenhouse-gas density or total atmospheric density | Px | kg m-3 | [M L-3] |
| Reference pressure (the minimum atmospheric pressure required a liquid solvent to exists at the surface) | Pr | Pa | [M L-1 T-2] |
Table 1: Variables employed in the Dimensional Analysis aimed at deriving a general planetary temperature model. The variables are comprised of 4 fundamental physical dimensions: mass [M], length [L], time [T] and absolute temperature [Θ].
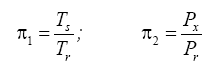
Appendix A details the procedure employed to construct the πi variables. DA yielded two sets of πi products, each one consisting of two dimensionless variables, i.e.,
and
This implies an investigation of two types of dimensionally homogeneous functions (relationships):
and
(2)
Note that π1=Ts/Tr occurs as a dependent variable in both relationships, since it contains the sought temperature Ts. Upon replacing the generic pressure/density variables Px and ρx in functions (1) and (2) with either partial pressure/density of greenhouse gases (Pgh and ρgh) or total atmospheric pressure/density (P and ρ), one arrives at six prospective regression models. Further, as explained further, we employed two distinct kinds of reference temperature computed from different formulas, i.e., an effective radiating equilibrium temperature (Te) and a mean ‘no-atmosphere’ spherical surface temperature (Tna) (Table 1). This doubled the πi instances in the regression analysis bringing the total number of potential models for investigation to twelve.
Reference temperatures and reference pressure
A reference temperature (Tr) characterizes the average thermal environment at the surface of a planetary body in the absence of atmospheric greenhouse effect; hence, Tr is different for each body and depends on solar irradiance and surface albedo. The purpose of Tr is to provide a baseline for quantifying the thermal effect of planetary atmospheres. Indeed, the Ts/Tr ratio produced by DA can physically be interpreted as a Relative Atmospheric Thermal Enhancement (RATE) ideally expected to be equal to or greater than 1.0. Expressing the thermal effect of a planetary atmosphere as a non-dimensional quotient instead of an absolute temperature difference (as done in the past) allows for an unbiased comparison of the greenhouse effects of celestial bodies orbiting at different distances from the Sun. This is because the absolute strength of the greenhouse effect (measured in K) depends on both solar insolation and atmospheric properties, while RATE being a radiation-normalized quantity is expected to only be a function of a planet’s atmospheric environment. To our knowledge, RATE has not previously been employed to measure the thermal effect of planetary atmospheres.
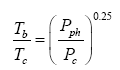
Two methods have been proposed thus far for estimating the average surface temperature of a planetary body without the greenhouse effect, both based on the SB radiation law. The first and most popular approach uses the planet’s global energy budget to calculate a single radiating equilibrium temperature Te (also known as an effective emission temperature) from the average absorbed solar flux [
6,
9,
28], i.e.,
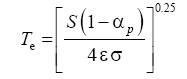
(3)
Here, S is the solar irradiance (W m-2) defined as the TOA shortwave flux incident on a plane perpendicular to the incoming rays, αp is the planetary Bond albedo (decimal fraction), ε is the planet’s LW emissivity (typically 0.9 ≤ ε <1 .0="" a="" al.="" assume="" based="" by="" et="" href="https://www.omicsonline.org/open-access/new-insights-on-the-physical-nature-of-the-atmospheric-greenhouse-effect-deduced-from-an-empirical-planetary-temperature-model.php?aid=88574#29" in="" lunar="" measurements="" on="" regolith="" reported="" study="" style="background-color: transparent; box-sizing: border-box; color: #004080; outline: none; text-decoration-line: none; transition: all 0.5s ease 0s;" this="" title="29" vasavada="" we="">29
], and σ=5.6704 × 10
-8 W m
-2 K-4 is the SB constant. The term S(1-α
p )⁄4 represents a globally averaged shortwave flux absorbed by the planetatmosphere system. The rationale behind Eq. (3) is that the TOA energy balance presumably defines a baseline temperature at a certain height in the free atmosphere (around 5 km for Earth), which is related to the planet’s mean surface temperature via the infrared optical depth of the atmosphere [
9,
10]. Equation (3) was introduced to planetary science in the early 1960s [
30,
31] and has been widely utilized ever since to calculate the average surface temperatures of airless (or nearly airless) bodies such as Mercury, Moon and Mars [
32] as well as to quantify the strength of the greenhouse effect of planetary atmospheres [
2-
4,
6,
9,
28]. However, Volokin et al. [
1] showed that, due to Hölder’s inequality between integrals [
33], Te is a non-physical temperature for spheres and lacks a meaningful relationship to the planet’s T
s.
The second method attempts to estimate the average surface temperature of a planet (Tna) in the complete absence of an atmosphere using an explicit spatial integration of the SB law over a sphere. Instead of calculating a single bulk temperature from the average absorbed shortwave flux as done in Eq. (3), this alternative approach first computes the equilibrium temperature at every point on the surface of an airless planet from the local absorbed shortwave flux using the SB relation, and then spherically integrates the resulting temperature field to produce a global temperature mean. While algorithmically opposite to Eq. (3), this method mimics well the procedure for calculating Earth’s global temperature as an area-weighted average of surface observations.
Rubincam [
34] proposed an analytic solution to the spherical integration of the SB law (his Eq. 15) assuming no heat storage by the regolith and zero thermal inertia of the ground. Volokin et al. [
1] improved upon Rubincam’s formulation by deriving a closed-form integral expression that explicitly accounts for the effect of subterranean heat storage, cosmic microwave background radiation (CMBR) and geothermal heating on the average global surface temperature of airless bodies. The complete form of their analytic Spherical Airless- Temperature (SAT) model reads:
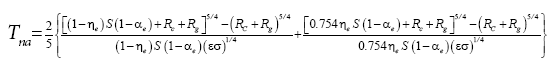
(4a)
where αe is the effective shortwave albedo of the surface, η
e is the effective ground heat storage coefficient in a vacuum, R
c=σ 2.725
4=3.13 × 10⁻⁶ W m
-2 is the CMBR [
35], and Rg is the spatially averaged geothermal flux (W m
-2) emanating from the subsurface. The heat storage term η
e is defined as a fraction of the absorbed shortwave flux conducted into the subsurface during daylight hour and subsequently released as heat at night.
Since the effect of CMBR on T
na is negligible for S>0.15 W m
-2 [
1] and the geothermal contribution to surface temperatures is insignificant for most planetary bodies, one can simplify Eq. (4a) by substituting R
c=R
g=0 This produces:
(4b)
where 0.932=0.754
0.25. The complete formula (4a) must only be used if S ≤ 0.15 W m
-2 and/or the magnitude of Rg is significantly greater than zero. For comparison, in the Solar System, the threshold S ≤ 0.15 W m
-2 is encountered beyond 95 astronomical unis (AU) in the region of the inner Oort cloud. Volokin et al. [
1] verified Equations (4a) and (4b) against Moon temperature data provided by the NASA Diviner Lunar Radiometer Experiment [
29,
36]. These authors also showed that accounting for the subterranean heat storage (η
e) markedly improves the physical realism and accuracy of the SAT model compared to the original formulation by Rubincam [
34].
The conceptual difference between Equations (3) and (4b) is that Τ
e represents the equilibrium temperature of a blackbody disk orthogonally illuminated by shortwave radiation with an intensity equal to the average solar flux absorbed by a sphere having a Bond albedo α
p, while Τna is the area-weighted average temperature of a thermally heterogeneous airless sphere [
1,
37]. In other words, for spherical objects, Τ
e is an abstract mathematical temperature, while T
na is the average kinetic temperature of an airless surface. Due to Hölder’s inequality between integrals, one always finds Τ
e>>Τna when using equivalent values of stellar irradiance and surface albedo in Equations (3) and (4b) [
1].
To calculate the T
na temperatures for planetary bodies with tangible atmospheres, we assumed that the airless equivalents of such objects would be covered with a regolith of similar optical and thermo-physical properties as the Moon surface. This is based on the premise that, in the absence of a protective atmosphere, the open cosmic environment would erode and pulverize exposed surfaces of rocky planets over time in a similar manner [
1]. Also, properties of the Moon surface are the best studied ones among all airless bodies in the Solar System. Hence, one could further simplify Eq. (4b) by combining the albedo, the heat storage fraction and the emissivity parameter into a single constant using applicable values for the Moon, i.e., αe=0.132, η
e=0.00971 and ε=0.98 [
1,
29]. This produces:
(4c)
Equation (4c) was employed to estimate the ‘no-atmosphere’ reference temperatures of all planetary bodies participating in our analysis and discussed below.
For a reference pressure, we used the gas-liquid-solid triple point of water, i.e., P
r=611.73P
a [
38] defining a baric threshold, below which water can only exists in a solid/vapor phase and not in a liquid form. The results of our analysis are not sensitive to the particular choice of a referencepressure value; hence, the selection of Pr is a matter of convention.
Regression analysis
Finding the best function to describe the observed variation of GMAT among celestial bodies requires that the πi variables generated by DA be subjected to regression analyses. As explained in Appendix A, twelve pairs of πi variables hereto called Models were investigated. In order to ease the curve fitting and simplify the visualization of results, we utilized natural logarithms of the constructed πi variables rather than their absolute values, i.e., we modeled the relationship In (π1)=f (In(π2)) nstead of π1=f(π2) In doing so we focused on monotonic functions of conservative shapes such as exponential, sigmoidal, hyperbolic, and logarithmic, for their fitting coefficients might be interpretable in physically meaningful terms. A key advantage of this type of functions (provided the existence of a good fit, of course) is that they also tend to yield reliable results outside the data range used to determine their coefficients. We specifically avoided non-monotonic functions such as polynomials because of their ability to accurately fit almost any dataset given a sufficiently large number of regression coefficients while at the same time showing poor predictive skills beyond the calibration data range. Due to their highly flexible shape, polynomials can easily fit random noise in a dataset, an outcome we particularly tried to avoid.
The following four-parameter exponential-growth function was found to best meet our criteria:
(5)
where x=In π
2 (and y=In π
1) are the independent and dependent variable respectively while a,b,c and d are regression coefficients. This function has a rigid shape that can only describe specific exponential patters found in our data. Equation (5) was fitted to each one of the 12 planetary data sets of logarithmic π
i pairs suggested by DA using the standard method of least squares. The skills of the resulting regression models were evaluated via three statistical criteria: coefficient of determination (R
2), adjusted R
2, and standard error of the estimate (σ
est) [
39,
40]. All calculations were performed with the SigmaPlot
™ 13 graphing and analysis software.
Planetary data
To ensure proper application of the DA methodology we compiled a dataset of diverse planetary environments in the Solar System using the best information available. Celestial bodies were selected for the analysis based on three criteria: (a) presence of a solid surface; (b) availability of reliable data on near-surface temperature, atmospheric composition, and total air pressure/density preferably from direct observations; and (c) representation of a broad range of physical environments defined in terms of TOA solar irradiance and atmospheric properties. This resulted in the selection of three planets: Venus, Earth, and Mars; and three natural satellites: Moon of Earth, Titan of Saturn, and Triton of Neptune.
Each celestial body was described by nine parameters shown in
Table 2 with data sources listed in
Table 3. In an effort to minimize the effect of unforced (internal) climate variability on the derivation of our temperature model, we tried to assemble a dataset of means representing an observational period of 30 years, i.e., from 1981 to 2010. Thus, Voyager measurements of Titan from the early 1980s suggested an average surface temperature of 94 ± 0.7 K [
41]. Subsequent observations by the Cassini mission between 2005 and 2010 indicated a mean global temperature of 93.4 ± 0.6 K for that moon [
42,
43]. Since Saturn’s orbital period equals 29.45 Earth years, we averaged the above global temperature values to arrive at 93.7 ± 0.6 K as an estimate of Titan’s 30-year GMAT. Similarly, data gathered in the late 1970s by the Viking Landers on Mars were combined with more recent Curiosity- Rover surface measurements and 1999-2005 remote observations by the Mars Global Surveyor (MGS) spacecraft to derive representative estimates of GMAT and atmospheric surface pressure for the Red Planet (
Table 2). Some parameter values reported in the literature did not meet our criteria for global representativeness and or physical plausibility and were recalculated using available observations as described below (
Table 3).
| Parameter | Venus | Earth | Moon | Mars | Titan | Triton |
|---|
| Average distance to the Sun, (AU) | 0.7233 | 1.0 | 1.0 | 1.5237 | 9.582 | 30.07 |
| Average TOA solar irradiance, (W m-2) | 2,601.3 | 1,360.9 | 1,360.9 | 586.2 | 14.8 | 1.5 |
| Bond albedo, (decimal fraction) | 0.900 | 0.294 | 0.136 | 0.235 | 0.265 | 0.650 |
| Average absorbed shortwave radiation, (W m-2) | 65.0 | 240.2 | 294.0 | 112.1 | 2.72 | 0.13 |
| Global average surface atmospheric pressure, (Pa) | 9,300,000.0 ± 100,000 | 98,550.0 ± 6.5 | 2.96 × 10⁻¹⁰ ± 10-10 | 685.4 ± 14.2 | 146,700.0 ± 100 | 4.0 ± 1.2 |
| Global average surface atmospheric density, (kg m-3) | 65.868 ± 0.44 | 1.193 ± 0.002 | 2.81 × 10⁻¹⁵ ± 9.4 × 10⁻¹⁵ | 0.019 ± 3.2 × 10⁻⁴ | 5.161 ± 0.03 | 3.45 × 10⁻⁴ ± 9.2 × 10⁻⁵ |
| Chemical composition of the lower atmosphere (% of volume) | 96.5 CO2
3.48 N20.02 SO2 | 77.89 N2
20.89 O20.932 Ar
0.248 H2O
0.040 CO2 | 26.7 4He
26.7 20Ne
23.3 H2
20.0 40Ar
3.3 22Ne | 95.32 CO2
2.70 N2
1.60 Ar
0.13 O2
0.08 CO
0.021 H2O | 95.1 N24.9 CH4 | 99.91 N2
0.060 CO
0.024 CH4 |
| Molar mass of the lower atmosphere, (kg mol-1) | 0.0434 | 0.0289 | 0.0156 | 0.0434 | 0.0274 | 0.0280 |
| GMAT, (K) | 737.0 ± 3.0 | 287.4 ± 0.5 | 197.35 ± 0.9 | 190.56 ± 0.7 | 93.7 ± 0.6 | 39.0 ± 1.0 |
Table 2: Planetary data set used in the Dimensional Analysis compiled from sources listed in Table 3. The estimation of Mars’ GMAT and the average surface atmospheric pressure are discussed in Appendix B. See Section 2.5 for details about the computational methods employed for some parameters.
| Planetary Body | Information Sources |
|---|
| Venus | [32-48] |
| Earth | [12,13,32,49-55] |
| Moon | [1,29,32,48,56-59] |
| Mars | [32,48,60-63] |
| Titan | [32,41-43,64-72] |
| Triton | [48,73-75] |
Table 3: Literature sources of the planetary data presented in Table 2.
The mean solar irradiances of all bodies were calculated as S=S
E r
au-2 where r
au is the body’s average distance (semi-major axis) to the Sun (AU) and S
E=1,360.9 W m
-2 is the Earth’s new lower irradiance at 1 AU according to recent satellite observations reported by Kopp and Lean [
49]. Due to a design flaw in earlier spectrometers, the solar irradiance at Earth’s distance has been overestimated by ≈ 5 W m
-2 prior to 2003 [
49]. Consequently, our calculations yielded slightly lower irradiances for bodies such as Venus and Mars compared to previously published data. Our decision to recalculate S was based on the assumption that the orbital distances of planets are known with much greater accuracy than TOA solar irradiances. Hence, a correction made to Earth’s irradiance requires adjusting the ‘solar constants’ of all other planets as well.
We found that quoted values for the mean global temperature and surface atmospheric pressure of Mars were either improbable or too uncertain to be useful to our analysis. Thus, studies published in the last 15 years report Mars’ GMAT being anywhere between 200 K and 240 K with the most frequently quoted values in the range 210–220 K [
6,
32,
76-
81]. However, in-situ measurements by Viking Lander 1 suggest that the average surface air temperature at a low-elevation site in the Martian subtropics does not exceed 207 K during the summerfall season (Appendix B). Therefore, the Red Planet’s GMAT must be lower than 207 K. The Viking records also indicate that average diurnal temperatures above 210 K can only occur on Mars during summertime. Hence, all such values must be significantly higher than the actual mean annual temperature at any Martian latitude. This is also supported by results from a 3-D global circulation model of the Red Planet obtained by Fenton et al. [
82]. The surface atmospheric pressure on Mars varies appreciably with season and location. Its global average value has previously been reported between 600 Pa and 700 Pa [
6,
32,
78,
80,
83,
84], a range that was too broad for the target precision of our study. Hence our decision to calculate new annual global means of near-surface temperature and air pressure for Mars via a thorough analysis of available data from remote-sensing and in-situ observations. Appendix B details our computational procedure with the results presented in
Table 2. It is noteworthy that our independent estimate of Mars’ GMAT (190.56 ± 0.7 K), while significantly lower than values quoted in recent years, is in perfect agreement with spherically integrated brightness temperatures of the Red Planet derived from remote microwave measurements in the late 1960s and early 1970s [
85-
87].
Moon’s GMAT was also not readily extractable from the published literature. Although lunar temperatures have been measured for more than 50 years both remotely and in situ [
36] most studies focus on observed temperature extremes across the lunar surface [
56] and rarely discuss the Moon’s average global temperature. Current GMAT estimates for the Moon cluster around two narrow ranges: 250–255 K and 269–271 K [
32]. A careful examination of the published data reveals that the 250–255 K range is based on subterranean heat-flow measurements conducted at depths between 80 and 140 cm at the Apollo 15 and 17 landing sites located at 26oN; 3.6° E and 20° N; 30.6° E, respectively [
88]. Due to a strong temperature dependence of the lunar regolith thermal conductivity in the topmost 1-2 cm soil, the Moon’s average diurnal temperature increases steadily with depth. According to Apollo measurements, the mean daily temperature at 35 cm belowground is 40–45 K higher than that at the lunar surface [
88]. The diurnal temperature fluctuations completely vanish below a depth of 80 cm. At 100 cm depth, the temperature of the lunar regolith ranged from 250.7 K to 252.5 K at the Apollo 15 site and between 254.5 K and 255.5 K at the Apollo 17 site [
88]. Hence, reported Moon average temperatures in the range 250-255 K do not describe surface conditions. Moreover, since measured in the lunar subtropics, such temperatures do not likely even represent Moon’s global thermal environment at these depths. On the other hand, frequently quoted Moon global temperatures of ~270 K are actually calculated from Eq. (3) and not based on surface measurements. However, as demonstrated by Volokin et al. [
1], Eq. (3) overestimates the mean global surface temperature of spheres by about 37%. In this study, we employed the spherical estimate of Moon’s GMAT (197.35 K) obtained by Volokin et al. [
1] using output from a NASA thermo-physical model validated against Diviner observations [
29].
Surprisingly, many publications report incorrect values even for Earth’s mean global temperature. Studies of
terrestrial climate typically focus on temperature anomalies and if Earth’s GMAT is ever mentioned, it is often loosely quoted as 15 C (~288 K) [
2-
4,
6]. However, observations archived in the HadCRUT4 dataset of the UK Met Office’s Hadley Centre [
50,
89] and in the Global Historical Climatology Network [
51,
52,
90,
91] indicate that, between 1981 and 2010, Earth’s mean annual surface air temperature was 287.4 K (14.3 C) ± 0.5 K. Some recent studies acknowledge this more accurate lower value of Earth’s absolute global temperature [
92]. For Earth’s mean surface atmospheric pressure we adopted the estimate by Trenberth et al. [
53] (98.55 kPa), which takes into account the average elevation of continental landmasses above sea level; hence, it is slightly lower than the typical sea-level pressure of ≈ 101.3 kPa.
The average near-surface atmospheric densities (p, kg m-3) of planetary bodies were calculated from reported means of total atmospheric pressure (P), molar mass (M, kg moL-1) and temperature (Ts) using the Ideal Gas Law, i.e.,

(6)
where R=8.31446 J moL-1 K-1 is the universal gas constant. This calculation was intended to make atmospheric densities physically consistent with independent data on pressure and temperature utilized in our study. The resulting p values were similar to previously published data for individual bodies. Standard errors of the air-density estimates were calculated from reported errors of and Τs for each body using Eq. (6).
Data in Table 2 were harnessed to compute several intermediate variables and all dimensionless πi products necessary for the regression analyses. The results from these computations are shown in Table 4. Greenhouse gases in planetary atmospheres represented by the major constituents carbon dioxide (CO2), methane (CH4) and water vapor (H2O) were collectively quantified via three bulk parameters: average molar mass (Mgh, kg moL-1), combined partial pressure (Pgh, Pa) and combined partial density (ρgh, kg m-3). These parameters were estimated from reported volumetric concentrations of individual greenhouse gases (Cx, %) and data on total atmospheric pressure and density in Table 2 using the formulas (Table 4):
| Intermediate Variable or Dimensionless Product | Venus | Earth | Moon | Mars | Titan | Triton |
|---|
| Average molar mass of greenhouse gases, (kg mol-1) (Eq. 7) | 0.0440 | 0.0216 | 0.0 | 0.0440 | 0.0160 | 0.0160 |
| Near-surface partial pressure of greenhouse gases, (Pa) (Eq. 8) | 8,974,500.0 ± 96,500 | 283.8 ± 0.02 | 0.0 | 667.7 ± 13.8 | 7,188.3 ± 4.9 | 9.6 × 10⁻⁴ ± 2.9 × 10⁻⁴ |
| Near-surface density of greenhouse gases, (kg m-3) (Eq. 9) | 64.441 ± 0.429 | 2.57 × 10⁻³ ± 4.3 × 10⁻⁶ | 0.0 | 0.018 ± 3.1 × 10⁻⁴ | 0.148 ± 8.4 × 10⁻⁴ | 4.74 × 10⁻⁸ ± 1.3 × 10⁻⁸ |
| Radiating equilibrium temperature, (K) (Eq. 3) | 185.0 | 256.4 | 269.7 | 211.9 | 83.6 | 39.2 |
| Average airless spherical temperature, (K) (Eq. 4c) | 231.7 | 197.0 | 197.0 | 159.6 | 63.6 | 35.9 |
| Ts/ Te | 3.985 ± 0.016 | 1.121 ± 0.002 | 0.732 ± 0.003 | 0.899 ± 0.003 | 1.120 ± 0.008 | 0.994 ± 0.026 |
| Ts/ Tna | 3.181 ± 0.013 | 1.459 ± 0.002 | 1.002 ± 0.004 | 1.194 ± 0.004 | 1.473 ± 0.011 | 1.086 ± 0.028 |
| In(Ts/Te) | 1.3825 ± 0.0041 | 0.1141 ± 0.0017 | -0.3123 ± 0.0046 | -0.1063 ± 0.0037 | 0.1136 ± 0.0075 | -5.2×10⁻³ ± 0.0256 |
| In(Ts/Tna) | 1.1573 ± 0.0041 | 0.3775 ± 0.0017 | 1.59×10⁻³ ± 0.0046 | 0.1772 ± 0.0037 | 0.3870 ± 0.0075 | 0.0828 ± 0.0256 |
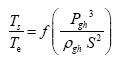
| In[(Pgh 3/(ρgh S2)] | 28.1364 | 8.4784 | Undefined | 10.7520 | 23.1644 | -4.7981 |
ln[P3/(ρgh S2)]
| 28.2433 | 26.0283 | +∞ | 10.8304 | 32.2122 | 20.2065 |
ln[Pgh3/(ρ S2)]
| 28.1145 | 2.3370 | Undefined | 10.7396 | 19.6102 | -13.6926 |
ln[Pgh/Pr]
| 9.5936 | -0.7679 | Undefined | 0.0876 | 2.4639 | -13.3649 |
ln[P3/(ρ S2)]
| 28.2214 | 19.8869 | -46.7497 | 10.8180 | 28.6580 | 11.3120 |
| In[P/Pr] | 9.6292 ± 0.0108 | 5.0820 ± 6.6×10⁻⁵ | -28.3570 ± 0.3516 | 0.1137 ± 0.0207 | 5.4799 ± 6.8×10⁻⁴ | -5.0300 ± 0.3095 |
Table 4: Intermediate variables and dimensionless products required for the regression analyses and calculated from data in Table 2. Equations used to compute intermediate variables are shown in parentheses. The reference pressure is set to the barometric triple point of water, i.e., Pr=611.73 Pa.

(7)
(8)
(9)
where Cgh=CCO2+CCH4+CH2O is the total volumetric concentration of major greenhouse gases (%). The reference temperatures Τe and Τna were calculated from Equations (3) and (4c), respectively.
Results
Function (5) was fitted to each one of the 12 sets of logarithmic πi pairs generated by Equations (1) and (2) and shown in Table 4. Figures 1 and 2 display the resulting curves of individual regression models with planetary data plotted in the background for reference. Table 5 lists the statistical scores of each non-linear regression. Model 12 depicted in Figure 2f had the highest R2=0.9999 and the lowest standard error σest=0.0078 among all regressions. Model 1 (Figure 1a) provided the second best fit with R2=0.9844 and σest=0.1529 Notably, Model 1 shows almost a 20-time larger standard error on the logarithmic scale than Model 12. Figure 3 illustrates the difference in predictive skills between the two top-performing Models 1 and 12 upon conversion of vertical axes to a linear scale. Taking an antilogarithm weakens the relationship of Model 1 to the point of becoming immaterial and highlights the superiority of Model 12. The statistical results shown in Table 5 indicate that the explanatory power and descriptive accuracy of Model 12 surpass these of all other models by a wide margin.
Figure 1: The relative atmospheric thermal enhancement (Ts/Tr) as a function of various dimensionless forcing variables generated by DA using data on solar irradiance, near-surface partial pressure/density of greenhouse gases, and total atmospheric pressure/density from Table 4. Panels a through f depict six regression models suggested by DA with the underlying celestial bodies plotted in the background for reference. Each pair of horizontal graphs represents different reference temperatures (Tr) defined as either Tr/Te (left) or Tr/Tna (right).
Figure 2: The same as in Figure 1 but for six additional regression models (panels a through f).
Figure 3: Comparison of the two best-performing regression models according to statistical scores listed in Table 5. Vertical axes use linear scales to better illustrate the difference in skills between the models.
| No. | Functional Model | Coefficient of Determination (R2) | Adjusted R2 | Standard Error |
|---|
| 1 |
| 0.9844 | 0.9375 | 0.1529 |
| 2 |  | 0.9562 | 0.8249 | 0.1773 |
| 3 |  | 0.1372 | -2.4511 | 1.1360 |
| 4 |  | 0.2450 | -2.0200 | 0.7365 |
| 5 |  | 0.9835 | 0.9339 | 0.1572 |
| 6 | 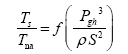 | 0.9467 | 0.7866 | 0.1957 |
| 7 | 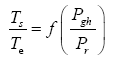 | 0.9818 | 0.9274 | 0.1648 |
| 8 | 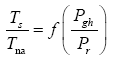 | 0.9649 | 0.8598 | 0.1587 |
| 9 | 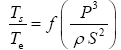 | 0.4488 | -0.3780 | 0.7060 |
| 10 | 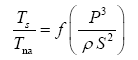 | 0.6256 | 0.0639 | 0.4049 |
| 11 | 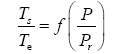 | 0.9396 | 0.8489 | 0.2338 |
| 12 | 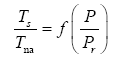 | 0.9999 | 0.9997 | 0.0078 |
Table 5: Performance statistics of the twelve regression models suggested by DA. Statistical scores refer to the model logarithmic forms shown in Figures 1 and 2.
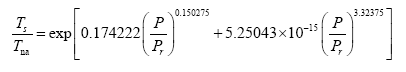
Since Titan and Earth nearly overlap on the logarithmic scale of Figure 2f, we decided to experiment with an alternative regression for Model 12, which excludes Titan from the input dataset. This new curve had R2=1.0 and σest=0.0009. Although the two regression equations yield similar results over most of the relevant pressure range, we chose the one without Titan as final for Model 12 based on the assumption that Earth’s GMAT is likely known with a much greater accuracy than Titan’s mean annual temperature. Taking an antilogarithm of the final regression equation, which excluded Titan, yields the following expression for Model 12:
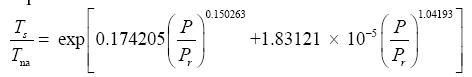
(10a)
The regression coefficients in Eq. (10a) are intentionally shown in full precision to allow an accurate calculation of RATE (i.e., the Ts/Tna ratios) provided the strong non-linearity of (Figures 1-3 and Table 5) the relationship and to facilitate a successful replication of our results by other researchers. Figure 4 depicts Eq. (10a) as a dependence of RATE on the average surface air pressure. Superimposed on this graph are the six planetary bodies from Table 4 along with their uncertainty ranges.
Figure 4: The relative atmospheric thermal enhancement (Ts/Tna ratio) as a function of the average surface air pressure according to Eq. (10a) derived from data representing a broad range of planetary environments in the solar system. Saturn’s moon titan has been excluded from the regression analysis leading to Eq. (10a). Error bars of some bodies are not clearly visible due to their small size relative to the scale of the axes. See Table 2 for the actual error estimates.
Equation (10a) implies that GMATs of rocky planets can be calculated as a product of two quantities: the planet’s average surface temperature in the absence of an atmosphere (Tna, K) and a nondimensional factor (Ea ≥ 1.0) quantifying the relative thermal effect of the atmosphere, i.e.,
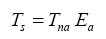
(10b)
where Τna is obtained from the SAT model (Eq. 4a) and Ea is a function of total pressure (P) given by:
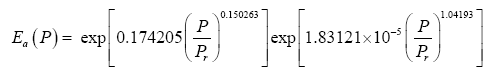
(11)
Note that, as P approaches 0 in Eq. (11), Ea approaches the physically realistic limit of 1.0. Other physical aspects of this equation are discussed below.
For bodies with tangible atmospheres (such as Venus, Earth, Mars, Titan and Triton), one must calculate Tna using αe=0.132 and ηe=0.00971, which assumes a Moon-like airless reference surface in accordance with our pre-analysis premise. For bodies with tenuous atmospheres (such as Mercury, the Moon, Calisto and Europa), Tna should be calculated from Eq. (4a) (or Eq. 4b respectively if S>0.15 W m-2 and/or Rg ≈ 0 W m-2) using the body’s observed values of Bond albedo αe and ground heat storage fraction ηe. In the context of this model, a tangible atmosphere is defined as one that has significantly modified the optical and thermo-physical properties of a planet’s surface compared to an airless environment and/or noticeably impacted the overall planetary albedo by enabling the formation of clouds and haze. A tenuous atmosphere, on the other hand, is one that has not had a measurable influence on the surface albedo and regolith thermos-physical properties and is completely transparent to shortwave radiation. The need for such delineation of atmospheric masses when calculating Tna arises from the fact that Eq. (10a) accurately describes RATEs of planetary bodies with tangible atmospheres over a wide range of conditions without explicitly accounting for the observed large differences in albedos (i.e., from 0.235 to 0.90) while assuming constant values of αe and ηe for the airless equivalent of these bodies. One possible explanation for this counterintuitive empirical result is that atmospheric pressure alters the planetary albedo and heat storage properties of the surface in a way that transforms these parameters from independent controllers of the global temperature in airless bodies to intrinsic byproducts of the climate system itself in worlds with appreciable atmospheres. In other words, once atmospheric pressure rises above a certain level, the effects of albedo and ground heat storage on GMAT become implicitly accounted for by Eq. (11). Although this hypothesis requires an investigation beyond the scope of the present study, one finds an initial support for it in the observation that, according to data in Table 2, GMATs of bodies with tangible atmospheres do not show a physically meaningful relationship with the amounts of absorbed shortwave radiation determined by albedos. Our discovery for the need to utilize different albedos and heat storage coefficients between airless worlds and worlds with tangible atmospheres is not unique as a methodological approach. In many areas of science and engineering, it is sometime necessary to use disparate model parameterizations to successfully describe different aspects of the same phenomenon. An example is the distinction made in fluid mechanics between laminar and turbulent flow, where the nondimensional Reynold’s number is employed to separate the two regimes that are subjected to different mathematical treatments.
We do not currently have sufficient data to precisely define the limit between
tangible and
tenuous atmospheres in terms of total pressure for the purpose of this model. However, considering that an atmospheric pressure of 1.0 Pa on Pluto causes the formation of layered haze [
93], we surmise that this limit likely lies significantly below 1.0 Pa. In this study, we use 0.01 Pa as a tentative threshold value. Thus, in the context of Eq. (10b), we recommend computing T
na from Eq. (4c) if P>10-2Pa, and from Eq. (4a) (or Eq. 4b, respectively) using observed values of αe and η
e if P ≤ 10-2Pa. Equation (4a) should also be employed in cases, where a significant geothermal flux Rg>>0 exists such as on the Galilean moons of Jupiter due to tidal heating, and/or if S ≤ 0.15 W m
-2. Hence, the 30-year mean global equilibrium surface temperature of rocky planets depends in general on five factors: TOA stellar irradiance (S), a reference airless surface albedo (αe), a reference airless ground heat storage fraction (η
e), the average geothermal flux reaching the surface (R
g), and the total surface atmospheric pressure (P). For planets with tangible atmospheres (P>10-2Pa) and a negligible geothermal heating of the surface (R
g ≈ 0), the equilibrium GMAT becomes only a function of two factors: S and P, i.e., Τ
s=32.44S0.25Eα (P). The final model (Eq. 10b) can also be cast in terms of T
s as a function of a planet’s distance to the Sun (r
au, AU) by replacing S in Equations (4a), (4b) or (4c) with 1360.9 r
au-2.
Environmental scope and numerical accuracy of the new model
Figure 5 portrays the residuals between modeled and observed absolute planetary temperatures. For celestial bodies participating in the regression analysis (i.e., Venus, Earth, Moon, Mars and Triton), the maximum model error does not exceed 0.17 K and is well within the uncertainty of observations. The error for Titan, an independent data point, is 1.45 K or 1.5% of that moon’s current best-known GMAT (93.7 K). Equation (10b) produces 95.18 K for Titan at Saturn’s semi-major axis (9.582 AU) corresponding to a solar irradiance S=14.8 W m
-2. This estimate is virtually identical to the 95 K average surface temperature reported for that moon by the NASA JPL Voyager Mission website [
94]. The Voyager spacecraft 1 and 2 reached Saturn and its moons in November 1980 and August 1981, respectively, when the gas giant was at a distance between 9.52 AU and 9.60 AU from the Sun corresponding approximately to Saturn’s semi-major axis [
95].
Data acquired by Voyager 1 suggested an average surface temperature of 94 ± 0.7 K for Titan, while Voyager 2 indicated a temperature close to 95 K [
41]. Measurements obtained between 2005 and 2010 by the Cassini-Huygens mission revealed T
s ≈ 93.4 ± 0.6 K [
42,
43]. Using Saturn’s perihelion (9.023 AU) and aphelion (10.05 AU) one can compute Titan’s TOA solar irradiance at the closest and furthest approach to the Sun, i.e., 16.7 W m
-2 and 13.47 W m
-2, respectively. Inserting these values into Eq. (10b) produces the expected upper and lower limit of Titan’s mean global surface temperature according to our model, i.e., 92.9 K ≤ T
s≤ 98.1 K. Notably this range encompasses all current observation-based estimates of Titan’s GMAT. Since both Voyager and Cassini mission covered shorter periods than a single Titan season (Saturn’s orbital period is 29.45 Earth years), the available measurements may not well represent that moon’s annual
thermal cycle. In addition, due to a thermal inertia, Titan’s average surface temperature likely lags variations in the TOA solar irradiance caused by Saturn’s orbital eccentricity. Thus, the observed 1.45 K discrepancy between our independent model prediction and Titan’s current best-known GMAT seems to be within the range of plausible global temperature fluctuations on that moon. Hence, further observations are needed to more precisely constrain Titan’s long-term GMAT.
Measurements conducted by the Voyager spacecraft in 1989 indicated a global mean temperature of 38 ± 1.0 K and an average atmospheric pressure of 1.4 Pa at the surface of Triton [
73]. Even though Eq. (10a) is based on slightly different data for Triton (i.e., T
s =39 ±1.0 K and P=4.0 Pa) obtained by more recent stellar occultation measurements [
73], employing the Voyager-reported pressure in Eq. (10b) produces T
s=38.5 K for Triton’s GMAT, a value well within the uncertainty of the 1989 temperature measurements (
Figure 5).
Figure 5: Absolute differences between modeled average global temperatures by Eq. (10b) and observed GMATs (from Table 2) for the studied celestial bodies. Saturn’s moon Titan represents an independent data point, since it was excluded from the regression analysis leading to Eq. (10a).
The above comparisons indicate that Eq. (10b) rather accurately describes the observed variation of the mean surface temperature across a wide range of planetary environments in terms of solar irradiance (from 1.5 W m-2 to 2,602 W m-2), total atmospheric pressure (from near vacuum to 9,300 kPa) and greenhouse-gas concentrations (from 0.0% to over 96% per volume). While true that Eq. (10a) is based on data from only 6 celestial objects, one should keep in mind that these constitute virtually all bodies in the Solar System meeting our criteria for availability and quality of measured data. Although function (5) has 4 free parameters estimated from just 5-6 data points, there are no signs of model overfitting in this case because (a) Eq. (5) represents a monotonic function of a rigid shape that can only describe well certain exponential pattern as evident from Figures 1 and 2 and statistical scores in Table 5; (b) a simple scatter plot of In (P/Pr) vs. In(Ts/Tna)visibly reveals the presence of an exponential relationship free of data noise; and (c) no polynomial can fit the data points in Figure 2f as accurately as Eq. (5) while also producing a physically meaningful response curve similar to known pressure-temperature relationships in other systems. These facts indicate that Eq. (5) is not too complicated to cause an over fitting but just right for describing the data at hand.
The fact that only one of the investigated twelve non-linear regressions yielded a tight relationship suggests that Model 12 describes a macro-level thermodynamic property of planetary atmospheres heretofore unbeknown to science. A function of such predictive power spanning the entire breadth of the Solar System cannot be just a result of chance. Indeed, complex natural systems consisting of myriad interacting agents have been known to sometime exhibit emergent responses at higher levels of hierarchical organization that are amenable to accurate modeling using top-down statistical approaches [
96]. Equation (10a) also displays several other characteristics discussed below that lend further support to the above notion.
Model robustness
Model robustness defines the degree to which a statistical relationship would hold when recalculated using a different dataset. To test the robustness of Eq. (10a) we performed an alternative regression analysis, which excluded Earth and Titan from the input data and only utilized logarithmic pairs of Ts/Tna and P/Pr for Venus, the Moon, Mars and Triton from Table 4. The goal was to evaluate how well the resulting new regression equation would predict the observed mean surface temperatures of Earth and Titan. Since these two bodies occupy a highly non-linear region in Model 12 (Figure 2f), eliminating them from the regression analysis would leave a key portion of the curve poorly defined. As in all previous cases, function (5) was fitted to the incomplete dataset (omitting Earth and Titan), which yielded the following expression:
(12a)
Substituting the reference temperature Tna in Eq. (12a) with its equivalent from Eq. (4c) and solving for Ts produces

(12b)
It is evident that the regression coefficients in the first exponent term of Eq. (12a) are nearly identical to those in Eq. (10a). This term dominates the Ts-Prelationship over the pressure range 0-400 kPa accounting for more than 97.5% of the predicted temperature magnitudes. The regression coefficients of the second exponent differ somewhat between the two formulas causing a divergence of calculated RATE values over the pressure interval 400 –9,100 kPa. The models converge again between 9,000 kPa and 9,300 kPa. Figure 6 illustrates the similarity of responses between Equations (10a) and (12a) over the pressure range 0–300 kPa with Earth and Titan plotted in the foreground for reference (Figure 6).
Figure 6: Demonstration of the robustness of Model 12. The solid black curve depicts Eq. (10a) based on data from 5 celestial bodies (i.e., Venus, Earth, Moon, Mars and Triton). The dashed grey curve portrays Eq. (12a) derived from data of only 4 bodies (i.e., Venus, Moon, Mars and Triton) while excluding Earth and Titan from the regression analysis. The alternative Eq. (12b) predicts the observed GMATs of Earth and Titan with accuracy greater than 99% indicating that Model 12 is statistically robust.
Equation (12b) reproduces the observed global surface temperature of Earth with an error of 0.4% (-1.0 K) and that of Titan with an error of 1.0% (+0.9 K). For Titan, the error of the new Eq. (12b) is even slightly smaller than that of the original model (Eq. 10b). The ability of Model 12 to predict Earth’s GMAT with an accuracy of 99.6% using a relationship inferred from disparate environments such as those found on Venus, Moon, Mars and Triton indicates that (a) this model is statistically robust, and (b) Earth’s temperature is a part of a cosmic thermodynamic continuum well described by Eq. (10b). The apparent smoothness of this continuum for bodies with tangible atmospheres (illustrated in Figure 4) suggests that planetary climates are wellbuffered and have no ‘tipping points’ in reality, i.e., states enabling rapid and irreversible changes in the global equilibrium temperature as a result of destabilizing positive feedbacks assumed to operate within climate systems. This robustness test also serves as a cross-validation suggesting that the new model has a universal nature and is not a product of over fitting.
The above characteristics of Eq. (10a) including dimensional homogeneity, high predictive accuracy, broad environmental scope of validity and statistical robustness indicate that it represents an emergent macro-physical model of potential theoretical significance deserving further investigation. This conclusive result is also supported by the physical meaningfulness of the response curve described by Eq. (10a).
Discussion
Given the high statistical scores of the new model (Eq. 10b) discussed above, it is important to address its physical significance, potential limitations, and broad implications for the current climate theory.
Similarity of the new model to Poisson’s formula and the SB radiation law
The functional response of Eq. (10a) portrayed in
Figure 4 closely resembles the shape of the dry adiabatic temperature curve in
Figure 7a described by the Poisson formula and derived from the First Law of Thermodynamics and the Ideal Gas Law [
4], i.e.,
Figure 7: Known pressure-temperature kinetic relations: (a) Dry adiabatic response of the air/surface temperature ratio to pressure changes in a free dry atmosphere according to Poisson’s formula (Eq. 13) with a reference pressure set to po=100 kPa; (b) The SB radiation law expressed as a response of a blackbody temperature ratio to variations in photon pressure (Eq. 14). Note the qualitative striking similarity of shapes between these curves and the one portrayed in Figure 4 depicting the new planetary temperature model (Eq. 10a).
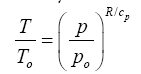
(13)
Here, To and po are reference values for temperature and pressure typically measured at the surface, while T and p are corresponding scalars in the free atmosphere, and cp is the molar heat capacity of air (J moL
-1 K
-1). For the Earth’s atmosphere, R/cp=0.286. Equation (13) essentially describes the direct effect of a pressure p on gas temperature (T) in the absence of any heat exchange with the surrounding
environment.
Equation (10a) is structurally similar to Eq. (13) in a sense that both expressions relate a temperature ratio to a pressure ratio, or more precisely, a relative thermal enhancement to a ratio of physical forces. However, while the Poisson formula typically produces 0≤ T/To ≤ 1.0Eq. (10a) always yields Ts/Tna ≥ 1.0. The key difference between the two models stems from the fact that Eq. (13) describes vertical temperature changes in a free and dry atmosphere induced by a gravity-controlled pressure gradient, while Eq. (10a) predicts the equilibrium response of a planet’s global surface air temperature to variations in total atmospheric pressure. In essence, Eq. (10b) could be viewed as a predictor of the reference temperature To in the Poisson formula. Thus, while qualitatively similar, Equations (10a) and (13) are quantitatively rather different. Both functions describe effects of pressure on temperature but in the context of disparate physical systems. Therefore, estimates obtained from Eq. (10a) should not be confused with results inferred from the Poisson formula. For example, Eq. (10b) cannot be expected to predict the temperature lapse rate and/or vertical temperature profiles within a planetary atmosphere as could be using Eq. (13). Furthermore, Eq. (10a) represents a top-down empirical model that implicitly accounts for a plethora of thermodynamic and radiative processes and feedbacks operating in real climate systems, while the Poisson formula (derived from the Ideal Gas Law) only describes pressure-induced temperature changes in a simple mixture of dry gases without any implicit or explicit consideration of planetary-scale mechanisms such as latent heat transport and cloud radiative forcing (Figure 7).
Equation (10a) also shows remarkable similarity to the SB law relating the equilibrium skin temperature of an isothermal blackbody (Tb, K) to the electromagnetic radiative flux (I, W m-2) absorbed/ emitted by the body’s surface, i.e., Tb=(I ⁄ σ)0.25. Dividing each side of this fundamental relationship by the irreducible temperature of deep Space Tc=2.725 K and its causative CMBR Rc=3.13 × 10⁻⁶ W m-2 respectively, yields Tb⁄Tc =(I ⁄ Rc )0.25. Further, expressing the radiative fluxes I and Rc on the right-hand side as products of photon pressure and the speed of light (c, m s-1) in a vacuum, i.e., I=cPph and Rc=cPc , leads to the following alternative form of the SB law:
(14)
where Pc=1.043 × 10⁻¹⁴ Pa is the photon pressure of CMBR. Clearly, Eq. (10a) is analogous to Eq. (14), while the latter is structurally identical to the Poisson formula (13). Figure 7b depicts Eq. (14) as a dependence of the ratio on photon pressure Pph.
It is evident from
Figures 4 and 7 that formulas (10a), (13) and (14) describe qualitatively very similar responses in quantitatively vastly different systems. The presence of such similar relations in otherwise disparate physical systems can fundamentally be explained by the fact that pressure as a force per unit area represents a key component of the internal kinetic energy (defined as a product of gas volume and pressure), while temperature is merely a physical manifestation of this energy. Adding a force such as gas pressure to a physical system inevitably boosts the internal kinetic energy and raises its temperature, a process known in
thermodynamics as compression heating. The direct effect of pressure on a system’s temperature is thermodynamically described by adiabatic processes. The pressure-induced thermal enhancement on a planetary level portrayed in
Figure 4 and accurately quantified by Eq. (10a or 11) is analogous to a compression heating, but not fully identical to an adiabatic process. The latter is usually characterized by a limited duration and oftentimes only applies to finite-size parcels of air moving vertically through the atmosphere. Equation (11), on the other hand, describes a surface thermal effect that is global in scope and permanent in nature as long as an atmospheric mass is present within the planet’s gravitational field. Hence, the planetary RATE (T
s/T
na ratio) could be understood as a net result of countless simultaneous adiabatic processes continuously operating in the free atmosphere.
Figures 4 and 7 also suggest that the pressure control of temperature is a universal thermodynamic principle applicable to systems ranging in complexity from a simple isothermal blackbody absorbing a homogeneous flux of electromagnetic radiation to diverse planetary atmospheres governed by complex non-linear process interactions and cloud-radiative feedbacks. To our knowledge, this cross-scale similarity among various pressure-temperature relationships has not previously been identified and may provide a valuable new perspective on the working of planetary climates.
Nevertheless, important differences exist between Eq. (10a) and these other simpler pressure-temperature relations. Thus, while the Poisson formula and the SB radiation law can mathematically be derived from ‘first principles’ and experimentally tested in a laboratory, Eq. (10a) could neither be analytically deduced from known physical laws nor accurately simulated in a small-scale experiment. This is because Eq. (10a) describes an emergent macro-level property of planetary atmospheres representing the net result of myriad process interactions within real climate systems that are not readily computable using mechanistic (bottom-up) approaches adopted in climate models or fully reproducible in a laboratory setting.
Potential limitations of the planetary temperature model
Equation (10b) describes the long-term (30 years) equilibrium GMATs of planetary bodies and does not predict inter-annual global
temperature variations caused by intrinsic fluctuations of cloud albedo and/or ocean heat uptake. Thus, the observed 0.82 K rise of Earth’s global temperature since 1880 is not captured by our model, since this warming was likely not the result of an increased atmospheric pressure. Recent analyses of observed dimming and brightening periods worldwide [
97-
99] suggest that the warming over the past 130 years might have been caused by a decrease in global cloud cover and a subsequent increased absorption of solar radiation by the surface. Similarly, the mega shift of Earth’s climate from a ‘hothouse’ to an ‘icehouse’ evident in the sedimentary archives over the past 51 My cannot be explained by Eq. (10b) unless caused by a large loss of atmospheric mass and a corresponding significant drop in surface air pressure since the early Eocene. Pleistocene fluctuations of global temperature in the order of 3.0–8.0 K during the last 2 My revealed by multiple proxies [
100] are also not predictable by Eq. (10b) if due to factors other than changes in total atmospheric pressure and/or TOA solar irradiance.
The current prevailing view mostly based on theoretical considerations and results from climate models is that the Pleistocene glacial-interglacial cycles have been caused by a combination of three forcing agents: Milankovitch orbital variations, changes in atmospheric concentrations of greenhouse gases, and a hypothesized positive icealbedo feedback [
101,
102]. However, recent studies have shown that orbital forcing and the ice-albedo feedback cannot explain key features of the glacial-interglacial oscillations such as the observed magnitudes of global temperature changes, the skewness of temperature response (i.e., slow glaciations followed by rapid meltdowns), and the mid- Pleistocene transition from a 41 Ky to 100 Ky cycle length [
103-
107]. The only significant forcing remaining in the present paleo-climatological toolbox to explicate the Pleistocene cycles are variations in greenhousegas concentrations. Hence, it is difficult to explain, from a standpoint of the current climate theory, the high accuracy of Eq. (11) describing the relative thermal effect of diverse planetary atmospheres without any consideration of greenhouse gases. If presumed forcing agents such as greenhouse-gas concentrations and the planetary albedo were indeed responsible for the observed past temperature dynamics on Earth, why did these agents not show up as predictors of contemporary planetary temperatures in our analysis as well? Could it be because these agents have not really been driving Earth’s climate on geological time scales? We address the potential role of greenhouse gases in more below. Since the relationship portrayed in
Figure 4 is undoubtedly real, our model results point toward the need to reexamine some fundamental climate processes thought to be well understood for decades. For example, we are currently testing a hypothesis that Pleistocene glacial cycles might have been caused by variations in Earth’s total atmospheric mass and surface air pressure. Preliminary results based on the ability of an extended version of our planetary model (simulating meridional temperature gradients) to predict the observed polar amplification during the Last Glacial Maximum indicate that such a hypothesis is not unreasonable. However, conclusive findings from this research will be discussed elsewhere.
According to the present understanding, Earth’s atmospheric pressure has remained nearly invariant during the Cenozoic era (i.e., last 65.5 My). However, this notion is primarily based on theoretical analyses [
106], since there are currently no known geo-chemical proxies permitting a reliable reconstruction of past pressure changes in a manner similar to that provided by various temperature proxies such as isotopic oxygen 18, alkenones and TEX86 in sediments, and Ar-N isotope ratios and deuterium concentrations in ice. The lack of independent pressure proxies makes the assumption of a constant atmospheric mass throughout the Cenozoic a priori and thus questionable. Although this topic is beyond the scope of our study, allowing for the possibility that atmospheric pressure on Earth might have varied significantly over the past 65.5 My could open exciting new research venues in Earth sciences in general and paleoclimatology in particular.
Role of greenhouse gasses from a perspective of the new model
Our analysis revealed a poor relationship between GMAT and the amount of greenhouse gases in planetary atmospheres across a broad range of environments in the Solar System (
Figures 1-3 and
Table 5). This is a surprising result from the standpoint of the current Greenhouse theory, which assumes that an atmosphere warms the surface of a planet (or moon) via trapping of radiant heat by certain gases controlling the atmospheric infrared
optical depth [
4,
9,
10]. The atmospheric opacity to LW radiation depends on air density and gas absorptivity, which in turn are functions of total pressure, temperature, and greenhouse-gas concentrations [
9]. Pressure also controls the broadening of infrared absorption lines in individual gases. Therefore, the higher the pressure, the larger the infrared optical depth of an atmosphere, and the stronger the expected greenhouse effect would be. According to the present climate theory, pressure only indirectly affects global surface temperature through the atmospheric infrared opacity and its presumed constraint on the planet’s LW emission to Space [
9,
107].
There are four plausible explanations for the apparent lack of a close relationship between GMAT and atmospheric greenhouse gasses in our results: 1) The amounts of greenhouse gases considered in our analysis only refer to near-surface atmospheric compositions and do not describe the infrared optical depth of the entire atmospheric column; 2) The analysis lumped all greenhouse gases together and did not take into account differences in the infrared spectral absorptivity of individual gasses; 3) The effect of atmospheric pressure on broadening the infrared gas absorption lines might be stronger in reality than simulated by current radiative-transfer models, so that total pressure overrides the effect of a varying atmospheric composition across a wide range of planetary environments; and 4) Pressure as a force per unit area directly impacts the internal kinetic energy and temperature of a system in accordance with thermodynamic principles inferred from the Gas Law; hence, air pressure might be the actual physical causative factor controlling a planet’s surface temperature rather than the atmospheric infrared optical depth, which merely correlates with temperature due to its co-dependence on pressure.
Based on evidences, we argue that option #4 is the most likely reason for the poor predictive skill of greenhouse gases with respect to planetary GMATs revealed in our study (
Figures 1-3). By definition, the infrared optical depth of an atmosphere is a dimensionless quantity that carries no units of force or energy [
3,
4,
9]. Therefore, it is difficult to fathom from a fundamental physics standpoint of view, how this non-dimensional parameter could increase the kinetic energy (and temperature) of the lower troposphere in the presence of free convection provided that the latter dominates the heat transport in gaseous systems. Pressure, on the other hand, has a dimension of force per unit area and as such is intimately related to the internal kinetic energy of an atmosphere E (J) defined as the product of gas pressure (P, Pa) and gas volume (V, m
3), i.e., E (J)=PV. Hence, the direct effect of pressure on a system’s internal energy and temperature follows straight from fundamental parameter definitions in classical thermodynamics. Generally speaking, kinetic energy cannot exist without a pressure force. Even electromagnetic radiation has pressure.
In climate models, the effect of infrared optical depth on surface temperature is simulated by mathematically decoupling radiative transfer from convective heat exchange. Specifically, the LW radiative transfer is computed in these models without simultaneous consideration of sensible- and latent heat fluxes in the solution matrix. Radiative transfer modules compute the so-called heating rates (K/ day) strictly as a function of atmospheric infrared opacity, which under constant-pressure conditions solely depends on greenhousegas concentrations. These heating rates are subsequently added to the thermodynamic portion of climate models and distributed throughout the atmosphere. In this manner, the surface warming becomes a function of an increasing atmospheric infrared opacity. This approach to modeling of radiative-convective energy transport rests on the principle of superposition, which is only applicable to linear systems, where the overall solution can be obtained as a sum of the solutions to individual system components. However, the integral heat transport within a free atmosphere is inherently nonlinear with respect to temperature. This is because, in the energy balance equation, radiant heat transfer is contingent upon power gradients of absolute temperatures, while convective cooling/heating depends on linear temperature differences in the case of sensible heat flux and on simple vapor pressure gradients in the case of latent heat flux [
4]. The latent heat transport is in turn a function of a solvent’s saturation vapor pressure, which increases exponentially with temperature [
3]. Thus, the superposition principle cannot be employed in energy budget calculations. The artificial decoupling between radiative and convective heat-transfer processes adopted in climate models leads to mathematically and physically incorrect solutions with regard to surface temperature. The LW radiative transfer in a real climate system is intimately intertwined with turbulent convection/advection as both transport mechanisms occur simultaneously. Since convection (and especially the moist one) is orders of magnitude more efficient in transferring energy than LW radiation [
3,
4], and because heat preferentially travels along the path of least resistance, a properly coupled radiative-convective algorithm of energy exchange will produce quantitatively and qualitatively different temperature solutions in response to a changing atmospheric composition than the ones obtained by current climate models. Specifically, a correctly coupled convective-radiative system will render the surface temperature insensitive to variations in the atmospheric infrared optical depth, a result indirectly supported by our analysis as well. This topic requires further investigation beyond the scope of the present study.
The direct effect of atmospheric pressure on the global surface temperature has received virtually no attention in climate science thus far. However, the results from our empirical data analysis suggest that it deserves a serious consideration in the future.
Theoretical implications of the new interplanetary relationship
The hereto discovered pressure-temperature relationship quantified by Eq. (10a) and depicted in Figure 4 has broad theoretical implications that can be summarized as follows:
Physical nature of the atmospheric ‘greenhouse effect’: According to Eq. (10b), the heating mechanism of planetary atmospheres is analogous to a gravity-controlled adiabatic compression acting upon the entire surface. This means that the atmosphere does not function as an insulator reducing the rate of planet’s infrared cooling to space as presently assumed [
9,
10], but instead adiabatically boosts the kinetic energy of the lower troposphere beyond the level of solar input through gas compression. Hence, the physical nature of the atmospheric ‘greenhouse effect’ is a pressure-induced thermal enhancement independent of atmospheric composition. This mechanism is fundamentally different from the hypothesized ‘trapping’ of LW radiation by atmospheric trace gases first proposed in the 19th century and presently forming the core of the Greenhouse climate theory. However, a radiant-heat trapping by freely convective gases has never been demonstrated experimentally. We should point out that the hereto deduced adiabatic (pressure-controlled) nature of the atmospheric thermal effect rests on an objective analysis of vetted planetary observations from across the Solar System and is backed by proven thermodynamic principles, while the ‘trapping’ of LW radiation by an unconstrained atmosphere surmised by Fourier, Tyndall and Arrhenius in the 1800s was based on a theoretical conjecture. The latter has later been coded into algorithms that describe the surface temperature as a function of atmospheric infrared optical depth (instead of pressure) by artificially decoupling radiative transfer from convective heat exchange. Note also that the Ideal Gas Law (PV=nRT) forming the basis of atmospheric physics is indifferent to the gas chemical composition.
Effect of pressure on temperature: Atmospheric pressure provides in and of itself only a relative thermal enhancement (RATE) to the surface quantified by Eq. (11). The absolute thermal effect of an atmosphere depends on both pressure and the TOA solar irradiance. For example, at a total air pressure of 98.55 kPa, Earth’s RATE is 1.459, which keeps our planet 90.4 K warmer in its present orbit than it would be in the absence of an atmosphere. Hence, our model fully explains the new ~90 K estimate of Earth’s atmospheric thermal effect derived by Volokin et al. [
1] using a different line of reasoning. If one moves Earth to the orbit of Titan (located at ~9.6 AU from the Sun) without changing the overall pressure, our planet’s RATE will remain the same, but the absolute thermal effect of the atmosphere would drop to about 29.2 K due to a vastly reduced solar flux. In other words, the absolute effect of pressure on a system’s temperature depends on the background energy level of the environment. This implies that the absolute temperature of a gas may not follow variations of pressure if the gas energy absorption changes in opposite direction to that of pressure. For instance, the temperature of Earth’s stratosphere increases with altitude above the tropopause despite a falling air pressure, because the absorption of UV radiation by ozone steeply increases with height, thus offsetting the effect of a dropping pressure. If the UV absorption were constant throughout the stratosphere, the air temperature would decrease with altitude.
Atmospheric back radiation and surface temperature: Since (according to Eq. 10b) the equilibrium GMAT of a planet is largely determined by the TOA solar irradiance and surface atmospheric pressure, the down-welling LW radiation appears to be globally a product of the air temperature rather than a driver of the surface warming. In other words, on a planetary scale, the so-called back radiation is a consequence of the atmospheric thermal effect rather than a cause for it. This explains the broad variation in the size of the observed down-welling LW flux among celestial bodies irrespective of the amount of absorbed solar radiation. Therefore, a change in this thermal flux brought about by a shift in atmospheric LW emissivity cannot be expected to impact the global surface temperature. Any variation in the global infrared back radiation caused by a change in atmospheric composition would be compensated for by a corresponding opposite shift in the intensity of the vertical convective heat transport. Such a balance between changes in atmospheric infrared heating and the upward convective cooling at the surface is required by the First Law of Thermodynamics. However, current climate models do not simulate this compensatory effect of sensible and latent heat fluxes due to an improper decoupling between radiative transfer and turbulent convection in the estimation of total energy exchange.
Role of planetary albedos: The fact that Eq. (10b) accurately describes planetary GMATs without explicitly accounting for the observed broad range of albedos, i.e., from 0.136 to 0.9 (
Table 2), indicates that the shortwave reflectivity of planetary atmospheres is mostly an intrinsic property (a byproduct) of the climate system itself rather than an independent driver of climate as currently believed. In other words, it is the internal energy of the atmosphere maintained by solar irradiance and air pressure that controls the bulk of the albedo. An indirect support for this unorthodox conclusion is provided by the observation that the amounts of absorbed shortwave radiation determined by albedos show no physically meaningful relationship with planetary GMATs. For example, data in
Table 2 indicate that Venus absorbs 3.7 times less
solar energy per unit area than Earth, yet its surface is about 450 K hotter than that of Earth; the Moon receives on average 54 W m
-2 more net solar radiation than Earth, but it is about 90 K cooler on average than our planet. The hereto proposed passive nature of planetary albedos does not imply that the global cloud cover could not be influenced by an external forcing such as solar wind, galactic cosmic rays, and/or gravitational fields of other celestial objects. Empirical evidence strongly suggests that it can [
108-
113], but the magnitude of such influences is expected to be small compared to the total albedo due to the presence of stabilizing negative feedbacks within the system. We also anticipate that the sensitivity of GMATs to an albedo change will greatly vary among planetary bodies. Viewing the atmospheric reflectivity as a byproduct of the available internal energy rather than a driver of climate can also help explain the observed remarkable stability of Earth’s albedo [
54,
114].
Climate stability: Our semi-empirical model (Equations 4a, 10b and 11) suggests that, as long as the mean annual TOA solar flux and the total atmospheric mass of a planet are stationary, the equilibrium GMAT will remain stable. Inter-annual and decadal variations of global temperature forced by fluctuations of cloud cover, for example, are expected to be small compared to the magnitude of the background atmospheric warming because of strong negative feedbacks limiting the albedo changes. This implies a relatively stable climate for a planet such as Earth absent significant shifts in the total atmospheric mass and the planet’s orbital distance to the Sun. Hence, planetary climates appear to be free of tipping points, i.e., functional states fostering rapid and irreversible changes in the global temperature as a result of hypothesized positive feedbacks thought to operate within the system. In other words, our results suggest that the Earth’s climate is well buffered against sudden changes.
Effect of oceans and water vapor on global temperature: The new model shows that the Earth’s global equilibrium temperature is a part of a cosmic thermodynamic continuum controlled by atmospheric pressure and total solar irradiance. Since our planet is the only one among studied celestial bodies harboring a large quantity of liquid water on the surface, Eq. (10b) implies that the oceans play virtually no role in determining Earth’s GMAT. This finding may sound inexplicable from the standpoint of the radiative Greenhouse theory, but it follows logically from the new paradigm of a pressure-induced atmospheric warming. The presence of liquid water on the surface of a planet requires an air pressure greater than 612 Pa and an ambient temperature above 273.2 K. These conditions are provided by the planet’s size and gravity, its distance to the Sun, and the mass of the atmosphere. Hence, the water oceans on Earth seem to be a thermodynamic consequence of particular physical conditions set by cosmic arrangements rather than an active controller of the global climate. Similarly, the hydrocarbon lakes on the surface of Titan [
115,
116] are the result of a high atmospheric pressure and an extremely cold environment found on that moon. Thus, our analysis did not reveal evidence for the existence of a feedback between planetary GMAT and a precipitable liquid solvent on the surface as predicted by the current climate theory. Consequently, the hypothesized runaway greenhouse, which requires a net positive feedback between global surface temperature and the atmospheric LW opacity controlled by water vapor [
117], appears to be a model artifact rather than an actual physical possibility. Indeed, as illustrated in
Figure 4, the hot temperature of Venus often cited as a product of a ‘runaway greenhouse’ scenario [
117,
118] fits perfectly within the pressuredependent climate continuum described by Equations (10b) and (11).
Model Application and Validation
Encouraged by the high predictive skill and broad scope of validity of Model 12 (Figure 2f) we decided to apply Eq. (10b) to four celestial bodies spanning the breadth of the Solar System, i.e., Mercury, Europa, Callisto and Pluto, which global surface temperatures are not currently known with certainty. Each body is the target of either ongoing or planned robotic exploration missions scheduled to provide surface thermal data among other observations, thus offering an opportunity to validate our planetary temperature model against independent measurements.
The MESSENGER spacecraft launched in 2004 completed the first comprehensive mapping of Mercury in March 2013 (
https://messenger.jhuapl.edu/). Among other things, the spacecraft also took infrared measurements of the planet’s surface using a special spectrometer [
119] that should soon become available. The New Horizons spacecraft launched in January 2006 [
120] reached Pluto in July of 2015 and performed a thermal scan of the dwarf planet during a flyby. The complete dataset from this flyby were received on Earth in October of 2016 and are currently being analyzed. A proposed joint Europa-Jupiter System Mission by NASA and the European Space Agency is planned to study the Jovian moons after year 2020. It envisions exploring Europa’s physical and thermal environments both remotely via a NASA Orbiter and
in situ by a Europa Lander [
121].
All four celestial bodies have somewhat eccentric orbits around the Sun. However, while Mercury’s orbital period is only 88 Earth days, Europa and Callisto circumnavigate the Sun once every 11.9 Earth years while Pluto takes 248 Earth years. The atmospheric pressure on Pluto is believed to vary between 1.0 and 4.0 Pa over the course of its orbital period as a function of insolation-driven sublimation of nitrogen and methane ices on the surface [
122]. Each body’s temperature was evaluated at three orbital distances from the Sun: aphelion, perihelion, and the semi-major axis. Since Mercury, Europa and Callisto harbor tenuous atmospheres (P<<10 span="" style="box-sizing: border-box; font-size: 10.5px; line-height: 0; position: relative; top: -0.5em; vertical-align: baseline;">-2
Pa), the reference temperature T
na in Eq. (10b) must be calculated from Eq. (4a), which requires knowledge of the actual values of αe, η
e, and R
g. We assumed that Mercury had R
g=0.0 W m
-2, α=0.068 [
123] and Moon-like thermo-physical properties of the regolith (η
e=0.00971). Input data for Europa and Callisto were obtained from Spencer et al. [
124], Moore et al. [
125], respectively. Specifically, to calculate η
e and Rg for these moons we utilized equatorial temperature data provided by Spencer et al. [
124] in their
Figure 1, and by Moore et al. [
125] in a figure along with a theoretical formula for computing the average nighttime surface temperature T at the equator based on the SB law, i.e.,
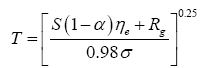
(15)
where S(1-α) η
e is the absorbed solar flux (W m
-2) stored as heat into the subsurface. The
geothermal heat flux on Europa is poorly known. However, based on thermal observations of Io reported by Veeder et al. [
126], we assumed Rg=2.0 W m
-2 for Europa. Using S=50.3 W m
-2, an observed nighttime equatorial temperature T=90.9 K and an observed average night-side albedo α=0.58 [
124], we solved Eq. (15) for the surface heat storage fraction to obtain η
e=0.085for Europa. A similar computational procedure was employed for Callisto using α=0.11 and equatorial surface temperature data in Moore et al. [
125]. This produced Rg=0.5 W m
-2 and η
e=0.057. Using these values in Eq. (15) correctly reproduced Callisto’s nighttime equatorial surface temperature of ≈ 86.0 K. The much higher η
e estimates for Europa and Callisto compared to η
e=0.00971 for the Moon can be explained with the large water-ice content on the surface of these Galilean moons. Europa is almost completely covered by a thick layer of water ice, which has a much higher thermal conductivity than the dry regolith. Also, sunlight penetrates deeper into ice than it does into powdered regolith. All this enables a much larger fraction of the absorbed solar radiation to be stored into the subsurface as heat and later released at night boosting the nighttime surface temperatures of these moons. Volokin et al. [
1] showed that GMAT of airless bodies is highly sensitive to η
e.
Table 6 lists the average global surface temperatures of the four celestial bodies predicted by Eq. (10b) along with the employed input data. According to our model, Mercury is about 117 K cooler on average than NASA’s current estimate of 440 K [
32], which is based on Eq. (3) and does not represent a spherically averaged surface temperature [
1]. Our prediction of Europa’s GMAT, 99.4 K, agrees well with the ≈ 100 K estimate reported for this moon by Sotin et al. [
127]. Our estimate of Pluto’s average surface temperature at perihelion (38.6 K) is similar to the mean temperature computed for that dwarf planet by Olkin et al. [
124] using a mechanistic model of nitrogen ice volatilization at the surface. Stern et al. [
128] and Gladstone et al. [
94] reported initial results from the flyby observations of Pluto taken by the Radio Experiment (REX) instrument aboard the New Horizons spacecraft in July 2015, when the dwarf planet was approximately at 32.9 AU from the Sun. Using the observed surface pressure of 1.05 ± 0.1 Pa (10.5 ± 1 μbar) our model predicts an average global temperature of 36.7 K for Pluto. Stern et al. [
128] reported a near-surface temperature of ≈ 38 K. However, this value was calculated from pre-flyby global brightness measurements rather than derived via spherical integration of spatially resolved surface temperatures (Stern, personal communication). Since global brightness temperatures tend to be higher than spherically averaged kinetic surface temperatures [
1], our model prediction may well be within the uncertainty of Pluto’s true global temperature. We will know more about this in 2017 when spatially resolved thermal measurements obtained by New Horizons become available.
| | Surface Atmospheric Pressure (Pa) | αe(fraction) ηe(fraction) Rg (W m-2) | Predicted Average Global Surface Temperature at Specific Orbital Distances from the Sun |
|---|
| Aphelion | Semi-major Axis | Perihelion |
|---|
| Mercury | 5 × 10⁻¹⁰ | αe=0.068
ηe=0.00971
Rg=0.0 | 296.8 K
(0.459 AU) | 323.3 K
(0.387 AU) | 359.5 K
(0.313 AU) |
| Europa | 10-7 | αe=0.62
ηe=0.085
Rg=2.0 | 98.1 K
(5.455 AU) | 99.4 K
(5.203 AU) | 100.7 K
(4.951 AU) |
| Callisto | 7.5 × 10⁻⁷ | αe=0.11
ηe=0.057
Rg=0.5 | 101.2 K
(5.455 AU) | 103.2 K
(5.203 AU) | 105.4 K
(4.951 AU) |
| Pluto | 1.05 | αe=0.132
ηe=0.00971
Rg=0.0 | 30.0 K
(49.310 AU) | 33.5 K
(39.482 AU) | 38.6 K
(29.667 AU) |
Table 6: Average global surface temperatures predicted by Eq. (10b) for Mercury, Europa, Calisto and Pluto. Input data on orbital distances (AU) and total atmospheric pressure (Pa) were obtained from the NASA Solar System Exploration [48] website, the NASA Planetary Factsheet [32] and Gladstone et al. [94]. Solar irradiances required by Eq. (10b) were calculated from reported orbital distances as explained. Values of αe, ηe and Rg for Europa and Callisto were estimated from observed data by Spencer et al. [124] and Moore et al. [125] respectively (see text for details).
One should use caution when comparing results from Eq. (10b) to remotely sensed ‘average temperatures’ commonly quoted for celestial bodies with tenuous atmospheres such as the moons of Jupiter and Neptune. Studies oftentimes report the so-called ‘brightness temperatures’ retrieved at specific wavelengths that have not been subjected to a proper spherical integration. As pointed out by Volokin et al. [
1], due to Hölder’s inequality between integrals, calculated brightness temperatures of spherical objects can be significantly higher than actual mean kinetic temperatures of the surface. Since Eq. (10b) yields spherically averaged temperatures, its predictions for airless bodies are expected to be lower than the disk-integrated brightness temperatures typically quoted in the literature.
Conclusion
For 190 years the atmosphere has been thought to warm Earth by absorbing a portion of the outgoing LW infrared radiation and reemitting it back toward the surface, thus augmenting the incident solar flux. This conceptualized continuous absorption and downward reemission of thermal radiation enabled by certain trace gases known to be transparent to solar rays but opaque to electromagnetic long-wavelengths has been likened to the trapping of heat by glass greenhouses, hence the term ‘atmospheric greenhouse effect’. Of course, we now know that real greenhouses preserve warmth not by trapping infrared radiation but by physically obstructing the convective heat exchange between a greenhouse interior and the exterior environment. Nevertheless, the term ‘greenhouse effect’ stuck in science.
The hypothesis that a freely convective atmosphere could retain (trap) radiant heat due its opacity has remained undisputed since its introduction in the early 1800s even though it was based on a theoretical conjecture that has never been proven experimentally. It is important to note in this regard that the well-documented enhanced absorption of thermal radiation by certain gases does not imply an ability of such gases to trap heat in an open atmospheric environment. This is because, in gaseous systems, heat is primarily transferred (dissipated) by convection (i.e., through fluid motion) rather than radiative exchange. If gases of high LW absorptivity/emissivity such as CO
2, methane and water vapor were indeed capable of trapping radiant heat, they could be used as insulators. However, practical experience has taught us that thermal radiation losses can only be reduced by using materials of very low IR absorptivity/emissivity and correspondingly high thermal reflectivity such as aluminum foil. These materials are known among engineers at NASA and in the construction industry as radiant barriers [
129]. It is also known that high-emissivity materials promote radiative cooling. Yet, all climate models proposed since 1800s were built on the premise that the atmosphere warms Earth by limiting radiant heat losses of the surface through to the action of IR absorbing gases aloft.
If a trapping of radiant heat occurred in Earth’s atmosphere, the same mechanism should also be expected to operate in the atmospheres of other planetary bodies. Thus, the Greenhouse concept should be able to mathematically describe the observed variation of average planetary surface temperatures across the Solar System as a continuous function of the atmospheric infrared optical depth and solar insolation. However, to our knowledge, such a continuous description (model) does not exist. Furthermore, measured magnitudes of the global down-welling LW flux on planets with thick atmospheres such as Earth and Venus indicate that the lower troposphere of these bodies contains internal kinetic energy far exceeding the solar input [
6,
12,
14]. This fact cannot be explained via re-radiation of absorbed outgoing thermal emissions by gases known to supply no additional energy to the system. The desire to explicate the sizable energy surplus evident in the tropospheres of some terrestrial planets provided the original impetus for this research.
We combined high-quality planetary data from the last three decades with the classical method of dimensional analysis to search for an empirical model that might accurately and meaningfully describe the observed variation of global surface temperatures throughout the
Solar System while also providing a new perspective on the nature of the atmospheric thermal effect. Our analysis revealed that the equilibrium global surface temperatures of rocky planets with tangible atmospheres and a negligible geothermal surface heating can reliably be estimated across a wide range of atmospheric compositions and radiative regimes using only two forcing variables: TOA stellar irradiance and total surface atmospheric pressure (Eq. 10b with T
na computed from Eq. 4c). Furthermore, the relative atmospheric thermal enhancement (RATE) defined as a ratio of the planet’s actual global surface temperature to the temperature it would have had in the absence of atmosphere is fully explicable by the surface air pressure alone (Eq. 10a and
Figure 4). At the same time, greenhouse-gas concentrations and/or partial pressures did not show any meaningful relationship to surface temperatures across a broad span of planetary environments considered in our study (see
Figures 1 and 2 and
Table 5).
Based on statistical criteria including numerical accuracy, robustness, dimensional homogeneity and a broad environmental scope of validity, the new relationship (Figure 4) quantified by Eq. (10a) appears to describe an emergent macro-level thermodynamic property of planetary atmospheres heretofore unbeknown to science. The physical significance of this empirical model is further supported by its striking qualitative resemblance to the dry adiabatic temperature curve described by the Poisson formula (Eq. 13) and to the photon-pressure form of the SB radiation law (Eq. 14). Similar to these well-known kinetic relations, Eq. (10a) also predicts the direct effect of pressure on temperature albeit in the context of a different macro-physical system. To our knowledge, this is the first model accurately describing the average surface temperatures of planetary bodies throughout the Solar System in the context of a thermodynamic continuum using a common set of drivers.
The planetary temperature model consisting of Equations (4a), (10b), (11) has several fundamental theoretical implications, i.e.,
• The ‘greenhouse effect’ is not a radiative phenomenon driven by the atmospheric infrared optical depth as presently believed, but a pressure-induced thermal enhancement analogous to adiabatic heating and independent of atmospheric composition;
• The down-welling LW radiation is not a global driver of surface warming as hypothesized for over 100 years but a product of the near-surface air temperature controlled by solar heating and atmospheric pressure;
• The albedo of planetary bodies with tangible atmospheres is not an independent driver of
climate but an intrinsic property (a byproduct) of the climate system itself. This does not mean that the cloud albedo cannot be influenced by external forcing such as solar wind or galactic cosmic rays. However, the magnitude of such influences is expected to be small due to the stabilizing effect of negative feedbacks operating within the system. This novel understanding explains the observed remarkable stability of planetary albedos;
• The equilibrium surface temperature of a planet is bound to remain stable (i.e., within ± 1 K) as long as the atmospheric mass and the TOA mean solar irradiance are stationary. Hence, Earth’s climate system is well buffered against sudden changes and has no tipping points;
• The proposed net positive feedback between surface temperature and the atmospheric infrared opacity controlled by water vapor appears to be a model artifact resulting from a mathematical decoupling of the radiative-convective heat transfer rather than a physical reality.
The hereto reported findings point toward the need for a paradigm shift in our understanding of key macro-scale atmospheric properties and processes. The implications of the discovered planetary thermodynamic relationship (Figure 4, Eq. 10a) are fundamental in nature and require careful consideration by future research. We ask the scientific community to keep an open mind and to view the results presented herein as a possible foundation of a new theoretical framework for future exploration of climates on Earth and other worlds.
Appendices
Appendix A. Construction of the Dimensionless π Variables
Table 1 lists 6 generic variables (T
s, T
r, S, P
x, P
r and ρ
x) composed of 4 fundamental dimensions: mass [M], length [L], time [T], and absolute temperature [Θ]. According to the Buckingham Pi theorem [
27], this implies the existence of two dimensionless π
iproducts per set. To derive the π
i variables we employed the following objective approach. First, we hypothesized that a planet’s GMAT (T
s) is a function of all 5 independent variables listed in
Table 1, i.e.

(B.1)
This unknown function is described to a first approximation as a simple product of the driving variables raised to various powers, i.e.
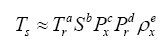
(A.2)
where a, b, c, d and e are rational numbers. In order to determine the power coefficients, Eq. (A.2) is cast in terms of physical dimensions of the participating variables, i.e.

(A.3)
Satisfying the requirement for dimensional homogeneity of Eq. (A.2) implies that the sum of powers of each fundamental dimension must be equal on both sides of Eq. (A.3). This allows us to write four simultaneous equations (one per fundamental dimension) containing five unknowns, i.e.
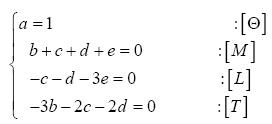
(A.4)
System (A4) is underdetermined and has the following solution:α=1, b=2e, and c=3e+d. Note that, in the DA methodology, one oftentimes arrives at underdetermined systems of equations, simply because the number of independent variables usually exceeds the number of fundamental physical dimensions comprising such variables. However, this has no adverse effect on the derivation of the sought dimensionless πi products.
Substituting the above roots in Eq. (A.2) reduces the original five unknowns to two: d and e, i.e.
(A.5a)
These solution powers may now be assigned arbitrary values, although integers such as 0, 1 and -1 are preferable, for they offer the simplest solution leading to the construction of proper πi variables. Setting d=0 and e=-1 reduces Eq. (A.5a) to
(A.5B)
providing the first pair of dimensionless products:
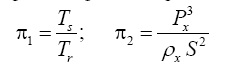
(A.6)
The second pair of πi variables emerges upon setting d=-1 and e=0 in Eq. (A.5a), i.e.
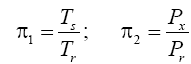
(A.7)
Thus, the original function (A.1) consisting of six dimensioned variables has been reduced to a relationship between two dimensionless quantities, i.e.π1=f (π2). This relationship must further be investigated through regression analysis.
Appendix B. Estimation of Mars’ GMAT and Surface Atmospheric Pressure
Although Mars is the third most studied planetary body in the Solar System after Earth and the
Moon, there is currently no consensus among researchers regarding its mean global surface temperature (TM). TM values reported over the past 15 years span a range of 40 K. Examples of disparate GMATs quoted for the Red Planet include 200 K [
79], 202 K [
82,
130], 210 K [
32], 214 K [
80], 215 K [
6,
81], 218 K [
77], 220 K [
76], 227 K [
131] and 240 K [
78]. The most frequently cited temperatures fall between 210 K and 220 K. However, a close examination of the available thermal observations reveals a high improbability for any of the above estimates to represent Mars’ true GMAT.
Figure B.1 depicts hourly temperature series measured at 1.5 m aboveground by Viking Landers 1 and 2 (VL1 and VL2 respectively) in the late 1970s [
60]. The VL1 record covers about half of a Martian year, while the VL2 series extends to nearly 1.6 years. The VL1 temperature series captures a summer-fall season on a site located at about 1,500 m below Datum elevation in the subtropics of Mars’ Northern Hemisphere (22.5° N). The arithmetic average of the series is 207.3 K (
Fig. B1a). Since the record lacks data from the cooler winter-spring season, this value is likely higher than the actual mean annual temperature at that location. Furthermore, observations by the Hubble telescope from the mid-1990s indicated that the Red Planet may have cooled somewhat since the time of the Viking mission [
132,
133]. Because of a thin atmosphere and the absence of significant cloud cover and perceptible water, temperature fluctuations near the surface of Mars are tightly coupled to diurnal, seasonal and latitudinal variations in incident solar radiation. This causes sites located at the same latitude and equivalent altitudes to have similar annual temperature means irrespective of their longitudes [
134]. Hence, one could reliably estimate a latitudinal temperature average on Mars using point observations from any elevation by applying an appropriate lapse-rate correction for the average terrain elevation of said latitude (
Figure B.1).
Figure B.1: Near-surface hourly temperatures measured on Mars by (a) Viking Lander 1 at Chryse Planitia (22.48° N, 49.97° W, Elevation: -1,500 m); and (b) Viking Lander 2 at Utopia Planitia (47.97° N, 225.74° W, Elevation: -3,000 m) (Kemppinen et al. [60]; data downloaded from:
https://www-k12.atmos.washington.edu/k12/ resources/mars_data-information/data.html). Black dashed lines mark the arithmetic average (T
mean) of each series. Grey dashed lines highlight the range of most frequently reported GMAT values for Mars, i.e., 210–240 K. The average diurnal temperature can only exceed 210 K during the summer; hence, all Martian latitudes outside the Equator must have mean annual temperatures significantly lower than 210 K.
At 22.5° absolute latitude, the average elevation between Northern and Southern Hemisphere on Mars is close to Datum level, i.e. about 1,500 m above the VL1 site. Adjusting the observed 207.3 K temperature average at VL1 to Datum elevation using a typical near-surface Martian lapse rate of -4.3 K km
-1 [
78] produces ~201 K for the average summerfall temperature at that latitude. Since the mean surface temperature of a sphere is typically lower than its subtropical temperature average, we can safely conclude based on
Figure B.1a that Mars’ GMAT is likely below 201 K. The mean temperature at the VL2 site located at ~48° N latitude and 3,000 m below Datum elevation is 191.1 K (
Fig. B.1b). The average terrain elevation between Northern and Southern Hemisphere at 48o absolute latitude is abouT
-1,500 m. Upon adjusting the VL2 annual temperature mean to -1,500 m altitude using a lapse rate of -4.3 K km
-1 we obtain 184.6 K. Since a planet’s GMAT numerically falls between the mean temperature of the Equator and that of 42° absolute latitude, the above calculations suggest that Mars’ GMAT is likely between 184 K and 201 K.
Figure B2: Mean annual surface air temperatures at five Martian absolute latitudes (gray dots) estimated from data provided by Viking Landers, Curiosity Rover, and the Mars Global Surveyor Radio Science Team. Each dot represents a mean annual temperature corresponding to the average terrain elevation between Northern and Southern Hemisphere for particular latitude. The black curve represents a third-order polynomial (Eq. B.1) fitted through the latitudinal temperature means via non-linear regression. Mars’ GMAT, TM=190.56 K (marked by a horizontal gray dashed line) was calculated via integration of polynomial (B.1) using formula (B.2).
A close examination of the Viking record also reveals that average diurnal temperatures above 210 K only occur on Mars during the summer season and, therefore, cannot possibly represent an annual mean for any Martian latitude outside the Equator. On the other hand, frequently reported values of Mars’ GMAT in excess of 210 K appear to be based on the theoretical expectation that a planet’s average surface temperature should exceed the corresponding effective radiating temperature produced by Eq. (3) [
78,
6], which is T
e ≈ 212 K for Mars. This presumption is rooted in the a priori assumption that Te represents a planet’s average surface temperature in the absence of atmospheric greenhouse effect. However, Volokin et al. [
1] have shown that, due to Hölder’s inequality between integrals, the mean physical temperature of a spherical body with a tenuous atmosphere is always lower than its effective radiating temperature computed from the globally integrated absorbed stellar flux. In other words, Eq. (3) yields non-physical temperatures for spheres. Indeed, based on results from a 3-D climate model Haberle [
130] concluded that Mars’ mean global surface temperature is at least 8 K cooler than the planet’s effective radiating temperature. Therefore, Mars’ GMAT must be inferred from actual measurements rather than from theoretical calculations.
In order to obtain a reliable estimate of Mars’ GMAT, we calculated the mean annual temperatures at several Martian latitudes employing near-surface time series measured in-situ by the Viking landers and Curiosity Rover, and remotely by the Mars Global Surveyor (MGS) spacecraft. The Radio Science Team (RST) at Stanford University utilized radio occultation of MGS refraction data to retrieve seasonal time-series of near-surface atmospheric temperature and pressure on Mars [
61,
62,
135]. We utilized MGS-RST data obtained between 1999 and 2005. Calculated mean temperatures from in-situ measurements were adjusted to corresponding average terrain elevations of target latitudes using a lapse rate of -4.3 K km
-1 [
78].
Figure B.2 portrays the estimated Mean Annual near-surface Temperatures (MAT) at five absolute Martian latitudes (gray dots) along with their standard errors (vertical bars). The equatorial MAT was calculated from Curiosity Rover observations; temperatures at absolute latitudes 0.392 rad (22.48°) and 0.837 rad (47.97°) were derived from VL measurements, while these at latitudes 1.117 rad (64°) and 1.396 rad (80°) were estimated from MGS-RST data. The black curve represents a third-order polynomial fitted through the latitudinal temperature averages and described by the polynomial:

(B.1)
with L being the absolute latitude (rad). MAT values predicted by Eq. (B.1) for Mars’ Equatorial and Polar Regions agree well with independent near-surface temperatures remotely measured by the Mars Climate Sounder (MCS), a platform deployed after MGS in 2006 [
136]. Shirley et al. [
136] showed that, although separated in time by 2-5 years, MCS temperature profiles match quite well those retrieved by MGS-RST especially in the lower portion of the Martian atmosphere.
Figures 2 and 3 of Shirley et al. [
136] depict nighttime winter temperature profiles over the Mars’ northern and southern Polar Regions, respectively at about 75° absolute latitude. The average winter surface temperature between the two Hemispheres for this latitude is about 148.5 K. This compares favorably with 156.4 K produced by Eq. (B.1) for 75° (1.309 rad) latitude considering that MAT values are expected to be higher than winter temperature averages.
Figures 4 and 5 of Shirley et al. [
136] portray average temperature profiles retrieved by MGS-RST and MCS over lowlands (165° – 180° E) and highlands (240° - 270° E) of the Mars’ equatorial region (8° N - 8° S), respectively. For highlands (≈5 km above Datum), the near-surface temperature appears to be around 200 K, while for lowlands (≈2.5 km below Datum) it is ≈211 K. Since most of Mars’ equatorial region lies above Datum, it is likely that Mars’ equatorial MAT would be lower than 205.5 K and close to our independent estimate of ≈203 K based on Curiosity Rover measurements.
Mars’ GMAT (TM) was calculated via integration of polynomial (B.1) using the formula:
(B.2)
(
Figure B.2) where 0 ≤ cosL ≤ 1 is a polar-coordinate area-weighting factor. The result is TM=190.56 ± 0.7 K (
Figure B.2). This estimate, while significantly lower than GMAT values quoted in recent publications, agrees quite well with spherically integrated brightness temperatures of Mars retrieved from remote microwave observations during the late 1960s and early 1970s [
85-
87]. Thus, according to Hobbs et al. [
85] and Klein [
86], the Martian mean global temperature (inferred from measurements at wavelengths between 1 and 21 cm) is 190 – 193 K. Our TM estimate is also consistent with the new mean surface temperature of the Moon (197.35 K) derived by Volokin et al. [
1] using output from a validated NASA thermo-physical model [
29]. Since Mars receives 57% less solar ittadiance than the Moon and has a thin atmosphere that only delivers a weak greenhouse effect [
9], it makes a physical sense that the Red Planet would be on average cooler than the Moon (i.e. TM<197 .3k="" 213="" a="" as="" average="" by="" diviner="" equator="" href="https://www.omicsonline.org/open-access/new-insights-on-the-physical-nature-of-the-atmospheric-greenhouse-effect-deduced-from-an-empirical-planetary-temperature-model.php?aid=88574#1" if="" is="" k="" latitude="" lunar="" moreover="" nasa="" observations="" of="" oon="" revealed="" s="" style="background-color: transparent; box-sizing: border-box; color: #004080; outline: none; text-decoration-line: none; transition: all 0.5s ease 0s;" temperature="" the="" title="1" warmest="">1
,
29], it is unlikely that Mars’ mean global temperature would be equal to or higher than 213 K as assumed by many studies [
6,
76-
78,
80,
131]
Published values of Mars’ average surface atmospheric pressures range from 600 Pa to 700 Pa [
6,
32,
78,
80,
124,
125]. Since this interval was too broad for the target precision of our study, we employed MGSRST data retrieved from multiple latitudes and seasons between 1999 and 2005 to calculate a new mean surface air pressure for the Red Planet. Our analysis produced P=685.4 ± 14.2 Pa, an estimate within the range of previously reported values.
Funding Sources
This research did not receive any specific grant from funding agencies in the public, commercial, or not-for-profit sectors.
References
- Volokin D, ReLlez L (2014) On the average temperature of airless spherical bodies and the magnitude of Earth's atmospheric thermal effect. Springer Plus 3: 723.
- Hansen J, Johnson D, Lacis A, Lebedeff S, Lee P, et al. (1981) Climate impact of increasing atmospheric carbon dioxide. Science 213: 957-966.
- Peixoto JP, Oort AH (1992) Physics of climate. Springer-Verlag, New York.
- Wallace JM, Hobbs PV (2006) Atmospheric science: An Introductory survey, Academic Press, California.
- Lacis AA, Schmidt GA, Rind D, Ruedy RA (2010) Atmospheric CO2: Principal control knob governing Earth’s temperature. Science 330.
- Lacis AA, Hansen JE, Russell GL, Oinas V, Jonas J (2013) The role of long-lived greenhouse gases as principal LW control knob that governs the global surface temperature for past and future climate change. Tellus B 65: 19734.
- Schmidt GA, Ruedy R, Miller RL, Lacis AA et al. (2010) The attribution of the present-day total greenhouse effect. J Geophys Res 115: D20106
- RamanathanV, Inamdar A (2006) The radiative forcing due to clouds and water vapor. Frontiers of Climate Modeling. Cambridge University Press, Cambridge, pp. 119-151.
- Pierrehumbert R (2010) Principles of planetary climate. Cambridge University Press, New York.
- Pierrehumbert R (2011) Infrared radiation and planetary temperature. Phys Today 64: 33-38
- Trenberth KE, Fasullo JT, Kiehl J (2009) Earth’s global energy budget. B Am Meteorol Soc March: 311-323.
- Stephens GL, Li1 J, Wild M, Clayson CA, Loeb N, et al. (2012) An update on Earth's energy balance in light of the latest global observations. Nat Geosci 5: 691–696.
- Wild M, Folini D, Schär C, Loeb N, Dutton EG, et al. (2013) The global energy balance from a surface perspective. Clim Dyn 40: 3107–3134.
- Wild M, Folini D, Hakuba MZ, Schar C, Seneviratne SI, et al. (2015) The energy balance over land and oceans: An assessment based on direct observations and CMIP5 climate models. Clim Dyn 44: 3393.
- Bengtsson L, Bonnet R-M, Grinspoon D, Koumoutsaris D, Lebonnois S, et al. (2013) Towards understanding the climate of Venus: Applications of terrestrial models to our sister planet, ISSI scientific report series, Springer.
- Rashevsky N (1960) Mathematical biophysics: Physico-mathematical foundations of biology. Dover Publications, New York.
- Albertson ML, Barton JR, Simons DB (1961) Fluid mechanics for engineers. Prentice Hall, New Jersey.
- Yalin MS (1971) Theory of hydraulic models. MacMillan.
- Taylor ES (1974) Dimensional analysis for engineers. Clarendon Press, Oxford.
- Bender EA, (1978) An introduction to mathematical modeling. John Wiley and Sons, NY.
- Vignaux GA, Jain S (1988) An approximate inventory model based on dimensional analysis. Asia-Pacific Journal of Operational Research 5: 117-123.
- Huntley HE (1967) Dimensional analysis. Dover Publications, New York.
- Vignaux GA (1991) Dimensional analysis in data modeling. In: Smith CR, Erickson G, Neudorfer PO (eds) Maximum entropy and Bayesian methods. Kluwer Academic Publishers, Seattle, pp 121-126
- Vignaux GA, Scott JL (1999) Theory and methods: Simplifying regression models using dimensional analysis. Aust N Z J Stat 41: 31–42.
- Van Der Ha JC, Lappas VJ (2007) Long-term attitude drift of spinning spacecraft under solar radiation torques. Journal of Guidance, Control and Dynamics 30: 1470-1479.
- McMahon J, Scheeres D (2010) A new navigation force model for solar radiation pressure. Journal of Guidance, Control and Dynamics 33: 1418-1428.
- Buckingham E (1914) On physically similar systems: Illustrations of the use of dimensional equations. Phys Rev 4: 345-376.
- Taylor FW (2010a) Planetary atmospheres. Oxford University Press, USA.
- Vasavada AR, Bandfield JL, Greenhagen BT, Hayne PO, Siegler MA, et al. (2012) Lunar equatorial surface temperatures and regolith properties from the diviner lunar radiometer experiment. J Geophy Res 117: E00H18.
- Blanco VM, McCuskey SW (1961) Basic physics of the solar system. Addison-Wesley, Reading MA.
- Möller F (1964) Optics of the lower atmosphere. Appl Optics 3: 157-166.
- Williams DR (2015) NASA Planetary Factsheet. NASA online.
- Beckenbach EF, Bellman R (1983) Inequalities. Springer Verlag, Berlin.
- Rubincam DP (2004) Black body temperature, orbital elements, the Milankovitch precession index and the Sever smith psychroterms. Theor Appl Climatol 79: 111–131.
- Fixsen DJ (2009) The temperature of the cosmic microwave background. Ap J 707: 916.
- Paige DA, Foote MC, Greenhagen BT, Schofield JT, Calcutt S, et al. (2010) The lunar reconnaissance orbiter diviner lunar radiometer experiment. Space Sci Rev 150: 125–160.
- Leconte J, Forget F, Charnay B, Wordsworth R, Selsis F, et al. (2013) 3D climate modeling of close-in land planets: circulation patterns, climate moist bistability and habitability. Astron Astrophys 554, A69
- Cengel YA, Turner RH (2004) Fundamentals of thermal-fluid sciences. McGraw-Hill, Boston.
- Steel RGD, Torrie J H (1960) Principles and procedures of statistics with special reference to the biological sciences. McGraw Hill.
- Zwillinger D (2003) Standard Mathematical Tables and Formulae. Chapman & Hall/CRC, p: 912.
- Atreya SK, Lorenz RD, Waite JH (2009) Volatile origin and cycles: Nitrogen and methane. In: Brown RH, Lebreton JP, Waite JH (eds) Titan from Cassini-Huygens. Springer, New York, pp: 177–200
- Jennings DE, Flasar FM, Kunde VG, Samuelson RE, Pearl JC, et al. (2009) Titan’s surface brightness temperatures. Astrophys J 691: L103–L105.
- Cottini V, Nixona CA, Jennings DE, et al. (2012) Spatial and temporal variations in Titan's surface temperatures from Cassini CIRS observations. Planetary Space Sci 60: 62–71.
- Fegley B, Zolotov MY, Lodders K (1997) The oxidation state of the lower atmosphere and surface of Venus. Icarus 125: 416-439.
- Basilevsky AT, Head JW (2003) The surface of Venus. Rep Prog Phys 66: 1699–1734.
- Mallama A, Wang D, Howard RA (2006) Venus phase function and forward scattering from H2SO4. Icarus 182: 10–22.
- Basilevsky AT, McGill GE (2007) Surface evolution of Venus: Esposito LW Exploring Venus as a Terrestrial Planet (Geophysical Monograph Series), Wiley 176: 23-43
- NASA Solar System Exploration (2014) Planets.
- Kopp G, Lean JL (2011) A new, lower value of total solar irradiance: Evidence and climate significance. Geophys Res Lett 38: L01706.
- Jones PD, New M, Parker DE, Martin S, Rigor IG (1999) Surface air temperature and its changes over the past 150 years, Rev Geophys 37: 173–199.
- NOAA National Climatic Data Center (2014) Global surface temperature anomalies. Online publication by NOAA.
- Smith TM, Reynolds RW, Peterson TC, Lawrimore J, et al. (2008) Improvements to NOAA's Historical Merged Land-Ocean Surface Temperature Analysis (1880-2006). J Climate 21: 2283-2296.
- Trenberth KE, Smith L (2005) The mass of the atmosphere: A constraint on global analyses. J Climate 18: 864-875.
- Stephens GL, O’Brien D, Webster PJ, Pilewski P, Kato S, et al. (2015) The albedo of Earth. Rev Geophys 53.
- Loeb NG, Wielicki BA, Doelling DR, Smith GL, Keyes DF, et al. (2009) Toward optimal closure of the Earth’s top-of-atmosphere radiation budget. J Climate 22:748–766
- Lucey, P Korotev RL, Gillis JJ, Taylor LA, Lawrence D, et al. (2006) Understanding the lunar surface and space-Moon interactions. Reviews in Mineralogy and Geochemistry 60: 83–219.
- Keihm SJ (1984) Interpretation of the lunar microwave brightness temperature spectrum: feasibility of orbital heat flow mapping. Icarus 60: 568–589.
- Vasavada AR, Paige DA, Wood SE (1999) Near-surface temperatures on Mercury and the Moon and the stability of polar ice deposits. Icarus 141: 179–193.
- Matthews G (2008) Celestial body irradiance determination from an underfilled satellite radiometer: Application to albedo and thermal emission measurements of the Moon using CERES. Applied Optics 47: 4981-4993.
- Kemppinen O, Tillman JE, Schmidt W, Harri AM (2013) New analysis software for Viking Lander meteorological data. Geosci Instrum Method Data Syst 2: 61–69.
- Hinson DP, Smith MD, Conrath BJ (2004) Comparison of atmospheric temperatures obtained through infrared sounding and radio occultation by Mars Global Surveyor. J Geophys Res 109: E12002.
- Hinson DP (2006) Radio occultation measurements of transient eddies in the northern hemisphere of Mars. J Geophys Res 111: E05002.
- Bandfield JL, Wolff MJ, Smith MD, Daniel JM (2013) Radiometric comparison of Mars Climate Sounder and Thermal Emission spectrometer measurements. Icarus 225: 28-39.
- Younkin RL (1974) The albedo of Titan. Icarus 21: 219–229.
- Hanel RA, Pearl JC, Samuelson RE (1985) The bolometric bond albedo of Titan. Bulletin of the Astronomical Society 17: 739.
- Neff JS, Ellis TA, Apt J, Bergstralh JT (1985) Bolometric albedos of Titan, Uranus, and Neptune. Icarus 62: 425–432.
- Fulchignoni M, Ferri F, Angrilli F, Ball AJ, Nub-Bar A, et al. (2005) In situ measurements of the physical characteristics of Titan's environment. Nature 438: 785-791.
- Niemann HB, Atreya SK, Bauer SJ, Carignan GR, Demick JE, et al. (2005) The abundances of constituents of Titan's atmosphere from the GCMS instrument on the Huygens probe. Nature 438: 779–784.
- Griffith CA (2007) Titan's lower atmosphere. AIP Conf Proc 930: 3-36.
- Mitri G, Showmana AP, Lunine JI, Lorenz RD (2007) Hydrocarbon lakes on Titan. Icarus 186: 385–394.
- Li L, Nixon CA, Achterberg RK, Smith MA, Gorius NJP, et al. (2011) The global energy balance of Titan. Geophys Res Lett 38: L23201.
- Schinder PJ, Flasar FM, Marouf EA, French RG, Mcghee-French C, et al. (2012) The structure of Titan’s atmosphere from Cassini radio occultation: Occultation from the Prime and Equinox missions. Icarus 221: 1020–1031.
- Lellouch E, de Bergh C, Sicardy B, Ferron S, Kaufl HU (2010) Detection of CO in Triton’s atmosphere and the nature of surface-atmosphere interactions. Astron Astrophys 512: L8.
- Nelson RM, Burattl BJ, Wallis BD, Smythe WD, Horn LJ, et al. (1990) Spectral geometric albedo and bolometric Bond albedo of Neptune's satellite Triton from Voyager observations. Geophys Res Lett 17: 1761–1764
- Elliot JL, Hammel HB, Wasserman LH, Franz OG, McDonald SW, et al. (1998) Global warming on Triton. Nature 393: 765-767.
- Smil V (2003) The Earth's biosphere: Evolution, dynamics and change. MIT Press.
- Vázquez M. Hanslmeier A (2006) Ultraviolet radiation in the solar system. Springer, The Netherlands.
- Barlow N (2008) Mars: An introduction to its interior, surface and atmosphere. Cambridge University Press, Cambridge.
- Rapp D (2008) Human missions to Mars: Enabling technologies for exploring the red planet. Springer, Germany.
- Taylor FW (2010b) The scientific exploration of Mars. Cambridge University Press, Cambridge NY
- Lissauer JJ, Pater I (2013) Fundamental planetary science: Physics, chemistry and habitability. Cambridge University Press, New York NY.
- Fenton LK, Geissler PE, Haberle RM (2007) Global warming and climate forcing by recent albedo changes on Mars. Nature 446: 647-649.
- Jakosky BM, Phillips RJ (2001) Mars' volatile and climate history. Nature 412: 237-244.
- Catling DC, Leovy C (2007) Mars atmosphere: History and surface interactions. In: Encyclopedia of the Solar System. Academic Press, pp: 301-314.
- Hobbs RW, McCullough TP, Waak JA (1968) Measurements of Mars at 1.55 cm and 0.95 cm wavelengths. Icarus 9: 360–363.
- Klein MJ (1971) Mars: measurements of its brightness temperature at 1.85 and 3.75 cm wavelength. Icarus 14: 210-213.
- Briggs FH, Drake FD (1972) Interferometric observations of Mars at 21 cm wavelength. Icarus 17: 543-547.
- Vaniman D, Reedy R, Heiken G, Haskin L, Greive R, et al. (1991) The lunar environment. In: Lunar Sourcebook: A User’s Guide to the Moon. Cambridge University Press, Cambridge, pp 27-60
- Morice CP, Kennedy JJ, Rayner NA, Jones PD (2012) Quantifying uncertainties in global and regional temperature change using an ensemble of observational estimates: The HadCRUT4 data set. J Geophys Res 117: D08101.
- Peterson TC, Vose RS (1997) An overview of the global historical climatology network temperature database. Bull Am Meteorol Soc 78: 2837-2849
- Smith TM, Reynolds RW (2005) A global merged land air and sea surface temperature reconstruction based on historical observations (1880-1997). J Climate 18: 2021-2036.
- Hansen J, Sato M, Russell G, Kharecha P (2013) Climate sensitivity, sea level and atmospheric carbon dioxide. Phil Trans R Soc A 371: 20120294.
- Gladstone GR, Stern SA, Ennico K, Olkin CB, Weaver HA, et al. (2016) The atmosphere of Pluto as observed by New Horizons. Science 351
- NASA JPL Voyager Mission (2013) Titan. Online publication by the California Institute of Technology.
- NASA JPL Ephemeris (2014) Horizons web interface: California Institute of Technology.
- Stolk H, Gates K, Hanan J (2003) Discovery of emergent natural laws by hierarchical multi-agent systems. In: Proceedings of the International Conference on Intelligent Agent Technology. IEEE/WIC International Conference on Intelligent Agent Technology, Halifax, Canada, pp: 75-82
- Wild M (2009) Global dimming and brightening: A review. J Geophys Res 114: D00D16.
- Herman J, DeLand MT, Huang L-K, Labow G, Larko D, et al.(2013) A net decrease in the Earth’s cloud, aerosol, and surface 340 nm reflectivity during the past 33 years (1979–2011). Atmos Chem Phys 13: 8505–8524.
- Stanhill GO, Rosa AR, Cohen S, Achiman O (2014) The cause of solar dimming and brightening at the Earth’s surface during the last half century: Evidence from measurements of sunshine duration J Geophys Res Atmos 119: 10902–10911.
- Snyder CW (2016) Evolution of global temperature over the past two million years. Nature 538: 226–228.
- Heinemann M, Timmermann A, Timm OE, Saito F, Abe-Ouchi A (2014) Deglacial ice sheet meltdown: orbital pace making and CO2 effects. Clim Past 10: 1567–1579.
- Stap LB, van de Wal RSW, de Boer B, Bintanja R, Lourens LJ (2014) Interaction of ice sheets and climate during the past 800 000 years. Clim Past 10: 2135–2152.
- McGehee R, Lehman C (2012) A paleoclimate model of ice-albedo feedback forced by variations in Earth’s orbit. Siam J App Dyn Sys 11: 684–707.
- Doughty AM, Schaefer JM, Putnam AE, Denton GH, Kaplan MR, et al. (2015) Mismatch of glacier extent and summer insolation in Southern Hemisphere mid-latitudes. Geology G36477.1.
- Maslin MA, Brierley CM (2015) The role of orbital forcing in the early middle Pleistocene transition. Quat Int 389: 47–55
- Berner RA (2006) Geological nitrogen cycle and atmospheric N2 over Phanerozoic time. Geology 34: 413-415.
- Vladilo G, Murante G, Silva L, Provenzale A, Ferri G, et al. (2013) The habitable zone of Earth-like planets with different levels of atmospheric pressure. Astrophys J 767: 65.
- Svensmark H, Bondo T, Svensmark J (2009) Cosmic ray decreases affect atmospheric aerosols and clouds. Geophys Res Lett 36: L15101.
- Svensmark J, Enghoff MB, Svensmark H (2012) Effects of cosmic ray decreases on cloud microphysics. Atmos Chem Phys Discuss 12: 3595–3617.
- Svensmark J, Enghoff MB, Shaviv N, Svensmark H (2016) The response of clouds and aerosols to cosmic ray decreases. J Geophys Res Space Physics 121: 8152-8181.
- Voiculescu M, Usoskin I, Condurache-Bota S (2013) Clouds blown by the solar wind. Environ Res Lett 8: 045032.
- Scafetta N (2016) High resolution coherence analysis between planetary and climate oscillations. Adv Space Res 57: 2121–2135.
- Kirkby J, Duplissy J, Sengupta K, Frege C, Gordon H, et al. (2016) Ion-induced nucleation of pure biogenic particles. Nature 533: 521–526.
- Palle E, Goode PR, Montañés-Rodríguez P, Shumko A, Gonzalez-Merino B, et al. (2016) Earth’s albedo variations 1998–2014 as measured from ground-based earthshine observations. Geophys Res Lett 43: 4531–4538.
- Raulin F (2008) Planetary science: Organic lakes on Titan. Nature 454: 587-589.
- Sharma P, Byrne S (2011) Comparison of Titan's north polar lakes with terrestrial analogs. Geophys Res Lett 38: L24203.
- Goldblatt C, Watson AJ (2012) The runaway greenhouse: Implications for future climate change, geoengineering and planetary atmospheres. Phil Trans R Soc A 370: 4197–4216.
- Kasting JF (1988) Runaway and moist greenhouse atmospheres and the evolution of Earth and Venus. Icarus 74: 472-494.
- McClintock WE, Lankton MR (2007) The Mercury atmospheric and surface composition spectrometer for the MESSENGER mission. Space Sci Rev 131: 481-521
- Stern SA (2008) The New Horizons Pluto Kuiper belt mission: An overview with historical context. Sp Sci Rev 140: 3-21.
- Pappalardo RT, Vance S, Bagenal F, Bills BG, Blaney DL, et al. (2013) Science potential from a Europa lander. Astrobiology 13: 740-773.
- Olkin CB, Young LA, Borncamp D, Pickles A, Sicardy B, et al. (2013) Pluto's atmosphere does not collapse. Cornell University Library, USA.
- Mallama A, Wang D, Howard RA (2002) Photometry of Mercury from SOHO/LASCO and Earth. Icarus 155: 253–264.
- Spencer JR, Tamppari LK, Martin TZ, Travis LD (1999) Temperatures on Europa from Galileo photopolarimeter-radiometer: Nighttime thermal anomalies. Science 284: 1514-1516.
- Moore JM, Chapman CR, Bierhaus EB, Greeley R, Chuang FC, et al. (2004) Callisto. In: Jupiter: The planet, satellites and magnetosphere. Cambridge University Press, pp 397-426
- Veeder GJ, Matson DL, Johnson TV, Blaney DL, Goguen JD (1994) Io’s heat flow from infrared radiometry: 1983–1993. J Geophys Res 99: 17095–17162.
- Sotin C, Head III JW, Tobie G (2002) Europa: Tidal heating of upwelling thermal plumes and the origin of lenticulae and chaos melting. Geophys Res Lett 29: 74-1–74-4.
- Stern SA, Bagenal F, Ennico K, Gladstone GR, Grundy WM, et al. (2015) The Pluto system: initial results from its exploration by New Horizons. Science 350.
- Asadi A, Hassan MM (2014) Evaluation of the thermal performance of a roof-mounted radiant barrier in residential buildings: Experimental study. J Building Phys 38: 66–80.
- Haberle RM (2013) Estimating the power of Mars’ greenhouse effect. Icarus 223: 619-620.
- Schulze-Makuch D, Méndez A, Fairén AG, von Paris P, Turse C, et al. (2011) A two-tiered approach to assessing the habitability of exoplanets. Astrobiology 11: 1041–1052.
- Savage D, Jones T, Villard R (1995) Hubble monitors weather on neighboring planets. Hubble News Release Archive.
- Clancy RT, Grossman AW, Wolff MJ, James PB, Rudy DJ, et al. (1996) Water vapor saturation at low altitudes around Mars aphelion: A key to Mars climate? Icarus 122: 36–62.
- Wilson RJ, Richardson MI (2000) The Martian atmosphere during the Viking mission: I Infrared measurements of atmospheric temperatures revisited. Icarus 145: 555–579.
- Mars Global Surveyor Radio Science Team (2007) The Daily Martian Weather Report. Online publication by Stanford University, USA.
- Shirley JH, Schofield J, Kleinböhl A, Abbatt JPD, Lollar BS, et al. (2011) Comparison of MGS Radio Science Mean temperature profiles with Mars Climate Sounder (MCS) results. In: Forget CF et al. (eds), ‘The Fourth International Workshop on the Mars Atmosphere: Modelling and observation’, Paris, France. Published online at.