The analysis also finds the jet stream/polar vortex is correlated to the natural 60-year climate cycle and solar activity, which is also confirmed by peer-reviewed papers and may represent another solar amplification mechanism.
Google translation + light editing, excerpt:
We summarize the claims of global warming promoters as: For the bitter cold in the United States, from the "Polar Vortex", you can thank global warming, because the temperature increase, faster and more intense at polar latitudes (just north of the other) reducing the temperature differential along latitudes is slow and deflects the jet stream, which is a stream of strong winds aloft that separate the polar air from the middle latitudes. This slowdown and deviation may favor the persistence and intensity of events such as those of these days.
Well, the air movement from west to east, that is, along the latitude, is defined technically as zonal flow. The polar jet is its engine, and the track, and flows at about 9,000 meters above sea level in the area of contact between cold polar air and the temperate mid-latitudes. An area whose position oscillates also important in the short and medium time scale, for instance days or weeks, but that fluctuates much less if one analyzes over longer periods. Similarly, of course, varies the intensity of this stream, which, however, always in the long period, being generated neither more nor less than from differences in mass and temperatures, is much less variable. Unless, as writes Holthaus, there is half of the global warming.
...Before going, however, note with joy that the average generic catastrophism has decided to use a climate skeptic thesis, namely that an increase in temperature decreases the latitudinal gradient. Since all the weather events are generated by a gradient, namely, a temperature difference, a decrease should NOT increase intense events connected to it. But let's get to the point. The one below is a chart that I asked him to prepare a Colarieti Carlo Tosti, the signature of our winter outlook ( here the last ). It is the zonal velocity (ie flow west-east) to the latitude and the altitude where it usually blows the polar jet over the whole circumference of the globe. The whole calculated for the entire period of data available on NOAA reanalysis, ie from 1948 to the present day. Data was superimposed on a curve that describes the trend, the period is about 60 years.
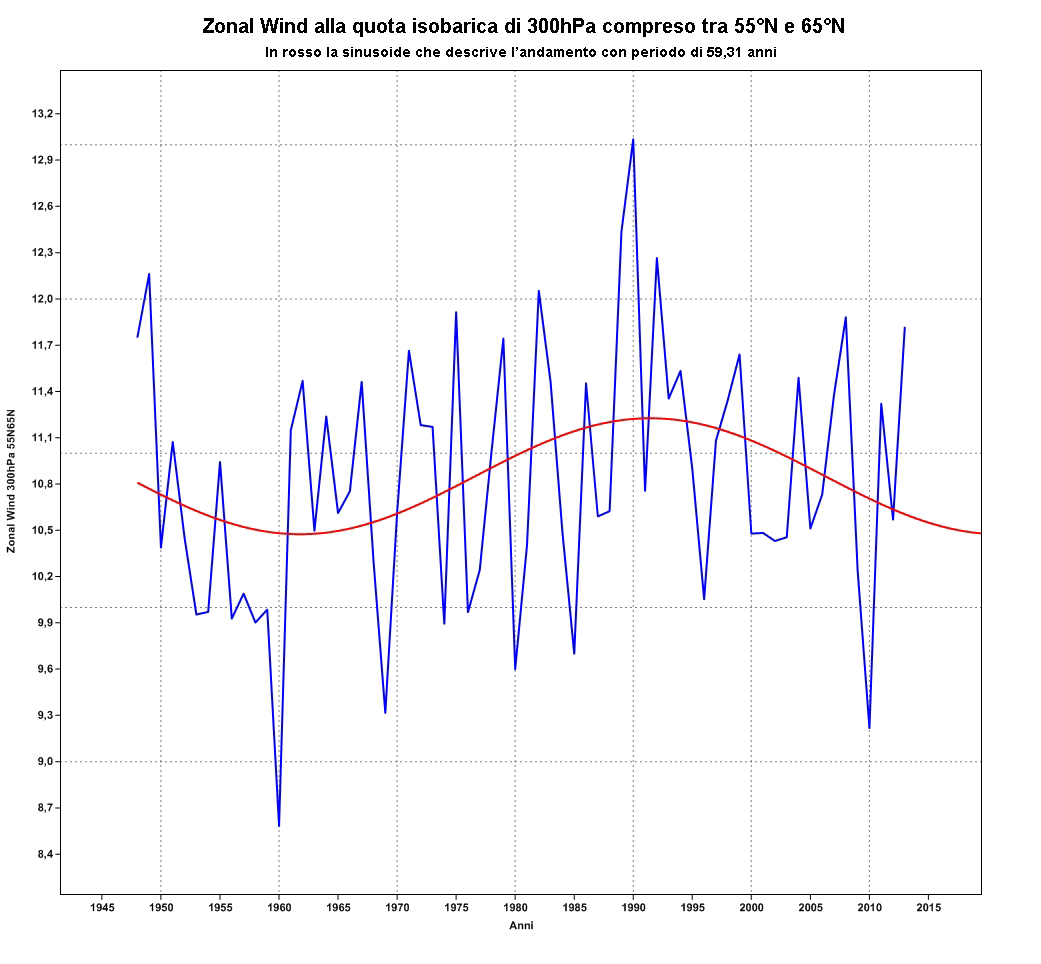 |
| Zonal flow over past 66 years shows the natural 60-year climate oscillation, with total absence of a long term trend. |
What we see now is:
- a strong interannual variability;
- a total absence of trend;
- the minimum speed in the vicinity of vintages historically cold;
- the maximum speed in the historically warm years;
- speed lower on average in cold weather
- higher average speed during warm periods, always from the same dataset.
- period of about 60 years (also found in many other datasets of atmospheric parameters, including temperatures [and ocean oscillations]) coincident with that of the solar activity.
All considerations that you might look into. But Holthaus has chosen to focus on just what the data is not there, in fact, the opposite of what is there, that is, a tendency to slow down the jet in coincidence of rising temperatures, which for those who do not remember going from mid-70s to late 90s, after global warming has gone into hibernation. And yes that would be enough to take a look at these data in order to understand, for example, that in this year 'freeze' for the U.S., the zonal velocity stationed in the upper part of the statistical distribution, ie, the jet is strong and strong, not slowed down and then forced to go for a walk in America as he says.
This is an example, like many other similar pieces of literature of how poor assurgendo resist the role of 'established facts', simply because the contents continue to be cited by the professionals of the impending catastrophe.
The study from which Holthaus and many others who populated the social media these days is was published in GRL released a couple of years ago:
And the evidence was removed just a year after getting published in GRL:
An excerpt of the abstract:
We analyze the trends in three reanalysis of atmospheric waves on the southern extension of North America and the North Atlantic, and it is shown that the positive trends reported above are probably an artifact of methodology. You do not find any significant reduction in the phase velocity of the planetary waves except inottobre-November-December, but this trend is sensitive to the parameters of analysis. In addition, the frequency of occurrence of blocks shows no significant increase in any season, claiming ultriormente the absence of trends in speed and southern extension of the waves.
And a good part of this is also seen in the chart higher, for which it has been adopted a method alone, take the data and look at them. But, the climate activists fly higher, so are not inclined to look at reality.
No comments:
Post a Comment